# Mapping #DataVisualization #BikeCrash
Bike Crash
; Design intervention for bike safety in Cambridge
Harvard Graduate School of Design | 2019
Instructor: Andres Sevtsuk (MIT City Form Lab)
Team: Dylan Halpern, Anne Hudson
Duration: 1 month
Role: Research, data collection, data visualization
Tools: Kepler.gl and Python with Jupyter notebook
Data:
- Hubway BlueBikes Trip and Station Data (2011-2019)
- MassDOT Road Network Data (2019)
- OpenStreetMap Network Data (Massachusetts Extract, 2019)
- MassDOT Crash Data (2011-2019)
- Cambridge Bicycle Lanes (2019)
- Cambridge and Somerville Parcel and Assessor’s Data (2019)
Featured: Boston Planning & Development Agency — Vision Zero meeting
︎ Project Website with Interactive Maps
> How might we identify the intersections most frequented by cyclists that have the highest number of vehicle accidents?
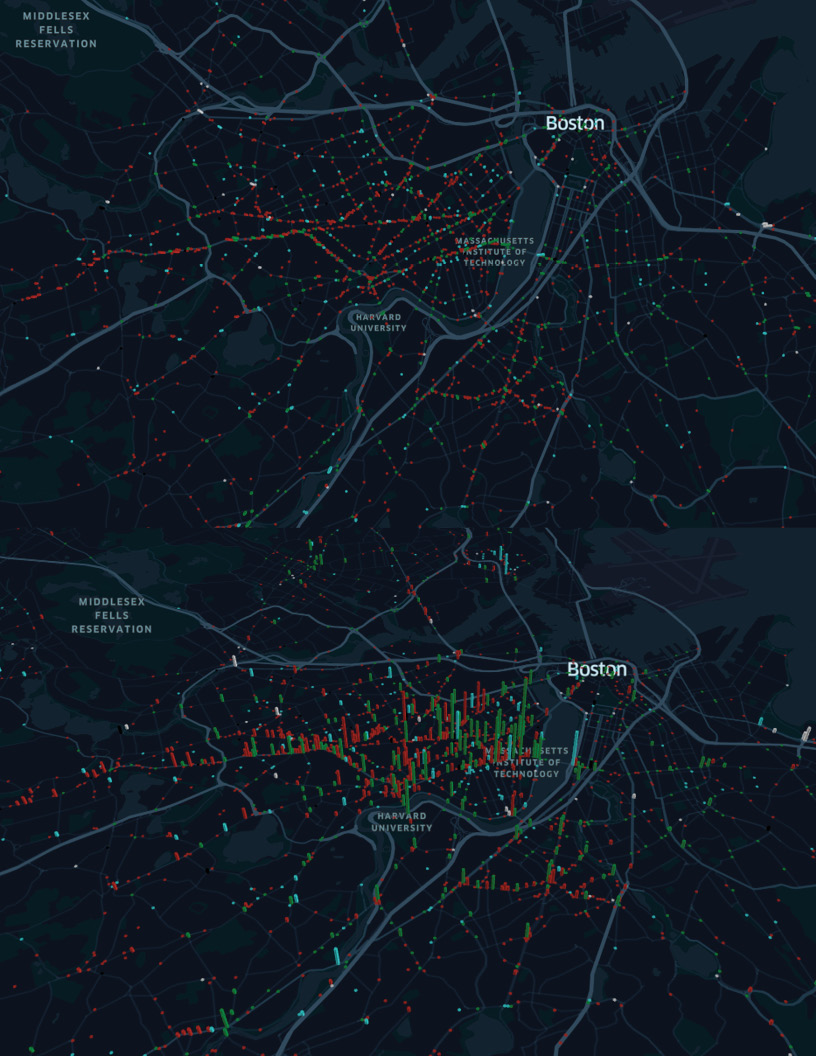
Crashes on streets (Red) | Crashes at intersections (Green)
Intersections have much higher frequency concentrated at certain locations
Intersections have much higher frequency concentrated at certain locations
| Problem |
Although we know about the incidents themselves, we know very little about ‘almost’ accidents or areas that are particularly dangerous for cyclists.
| Goal |
Understanding the risk to cyclists and improving routes by contextualizing crash incidents with traffic volume relative to the area.
>> Spatial joined the frequencies of unique Origin-Destination pairs from the BlueBikes data and the Crash data
Data Analysis and Visualization
| Trips |
 Origin-Destination Map (2011 - 2019)
Origin-Destination Map (AM / PM)
| Crashes Analysis |
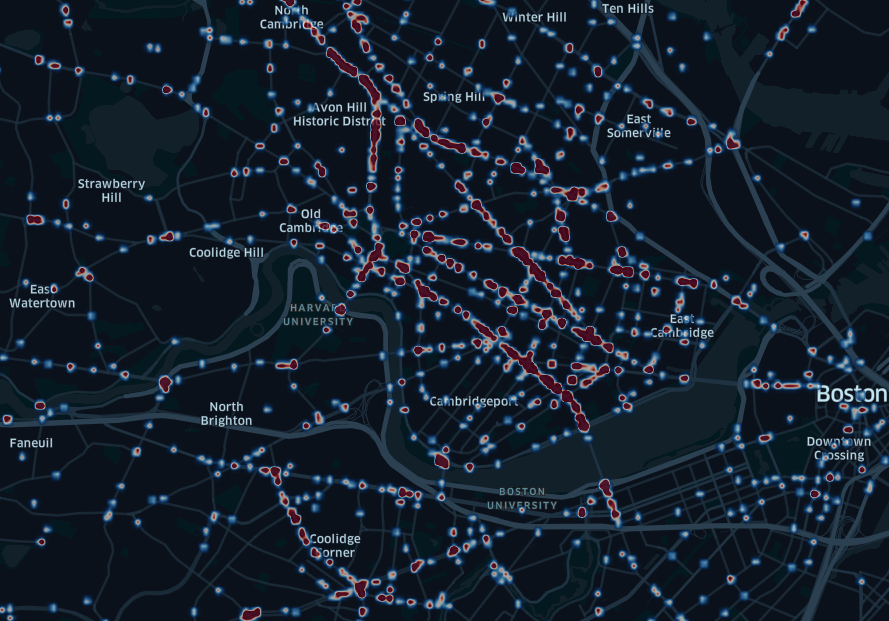
Crash heatmap
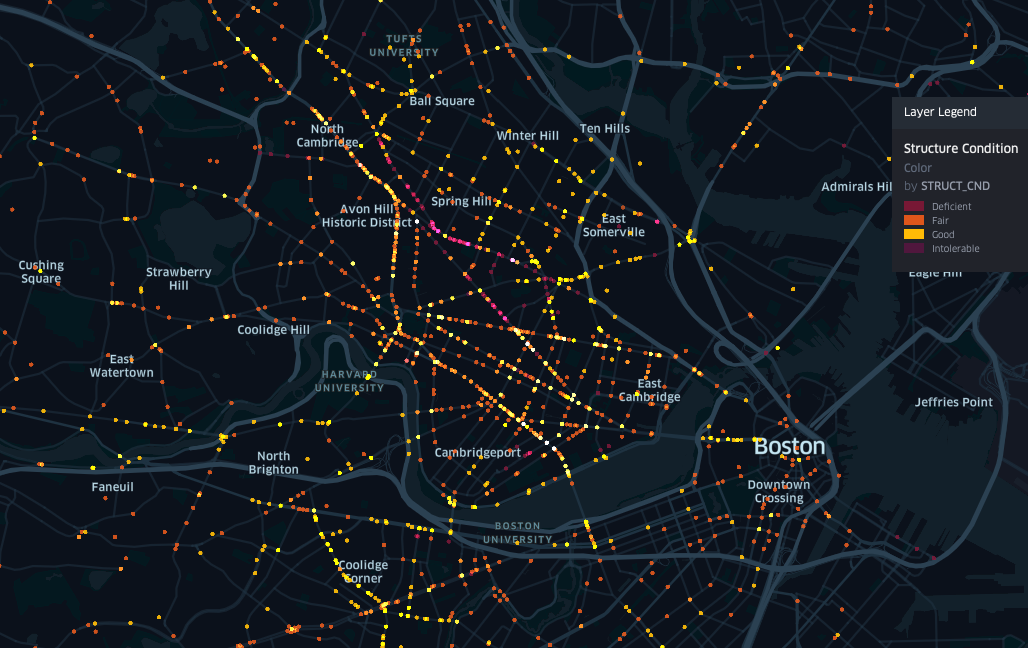
Structure condition
| Before and After 2016 |
![]() Before 2016 (L) | After 2016 with bike lanes(R)
Before 2016 (L) | After 2016 with bike lanes(R)
The rate of bike accidents per 100,000 bikers passing through intersections in Boston/Cambridge.
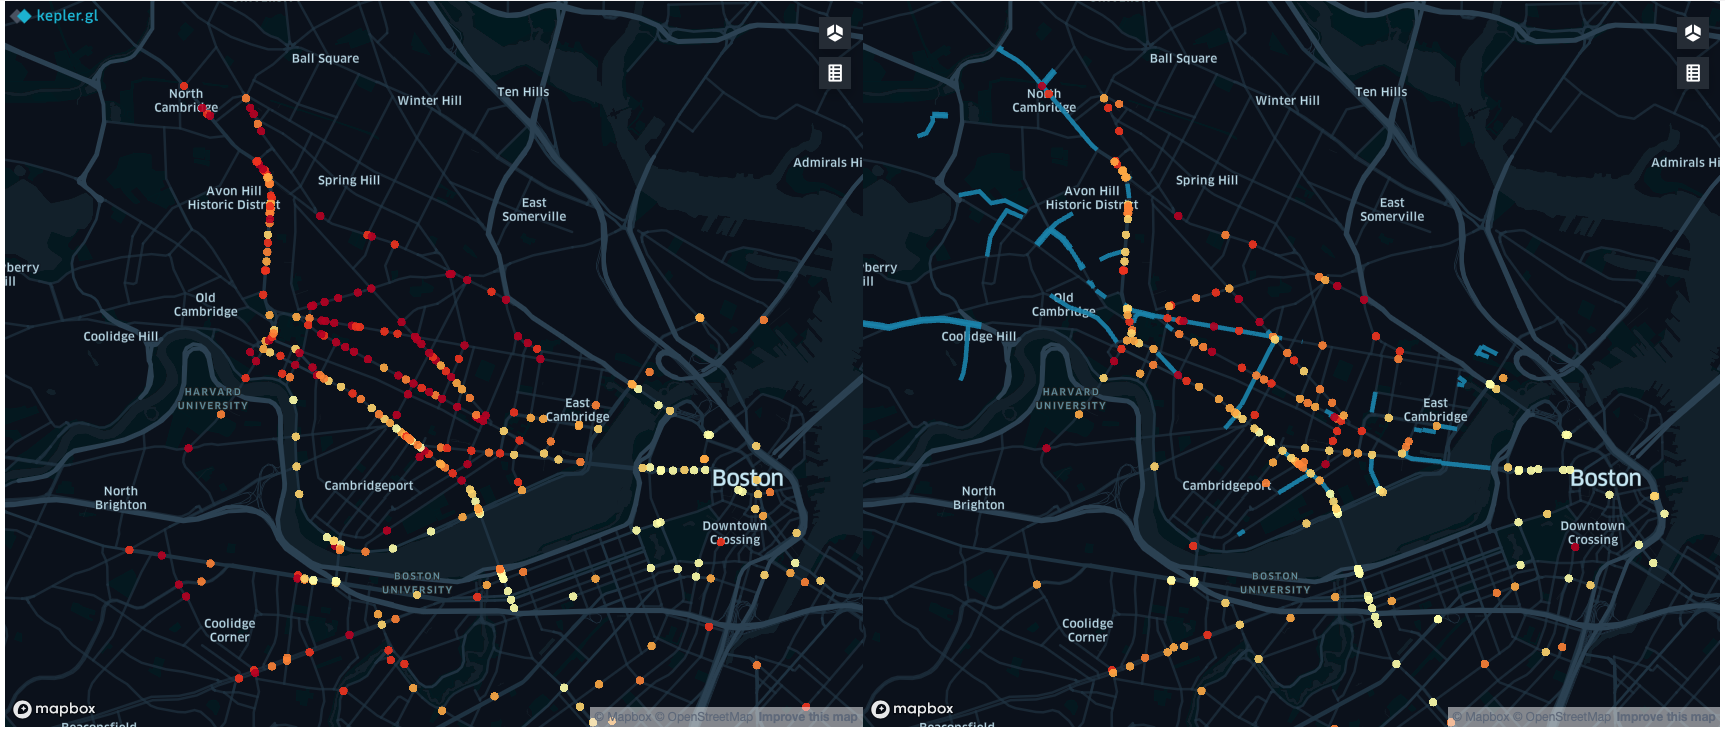 Before 2016 (L) | After 2016 with bike lanes(R)
 The rate of bike accidents per 100,000 bikers passing through intersections in Boston/Cambridge.
Beyond “geometric” interventions (e.g. bike lanes) it is important to note that timing changes can be very important to bike safety. Some of the intersections shown in the map may not have have any bike lanes added, but saw a reduction in accidents due to better light timing.
Key Findings
Attributes of dangerous Intersections
Turns off busy roads
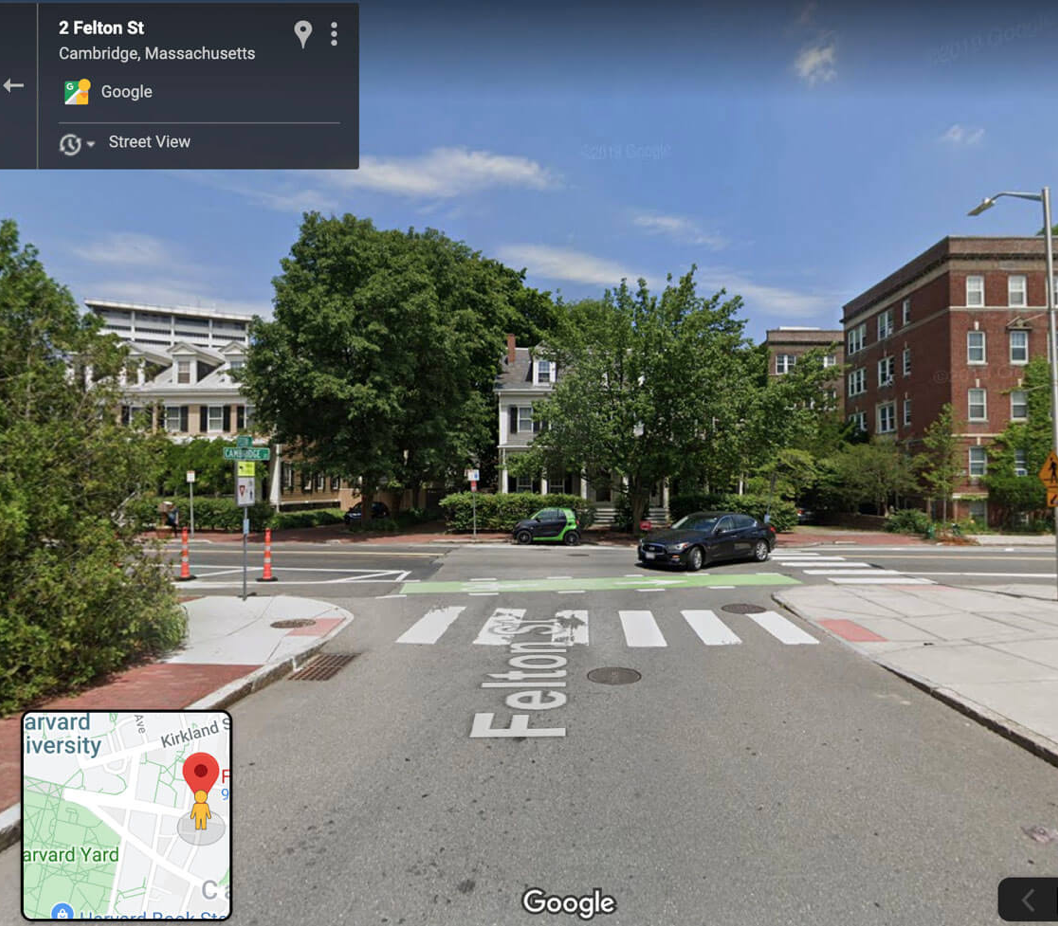
Wierd Intersections
Non-signalized smaller-scale inersections
 example. busy road to small street
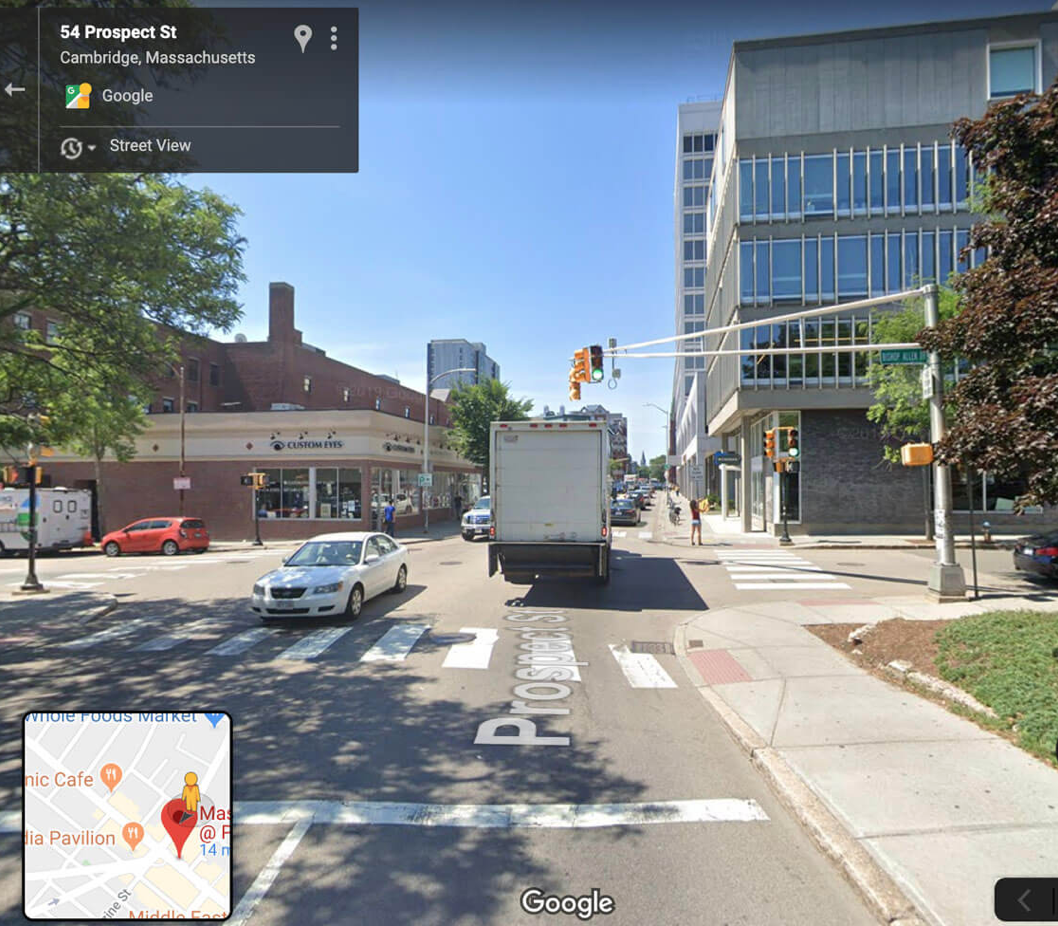 example. standard intersection
 example. weird intersection
Recommendations
Small, targeted interventions
Very targeted interventions can make a difference across an entire route. e.g. aright-turn-lane signal or a strategically-placed lane-marking
All-or-nothing
Intersections might be so complicated that even relatively large-scale design changes don’t make a difference. Instead of investment in large-scale lane markings, perhaps cities could rethink the intersection itself.
No one-size-fits-all solution
Interestingly, the results of changes to accident rates are very intersection-specific. There is no one-size-fits-all design solution!
This places immense value on local knowledge and a local-specific understanding traffic flows and bicycle flows.
︎ Visit the Project Website For More Interactive Maps and Details