#UrbanResearch #Thesis
Journey as Destination (Research)
; route choice improvement by measuring pedestrian experience
Harvard Graduate School of Design | Thesis
Instructor: Alex Krieger, Andres Sevtsuk
Tools: ArcGIS, Python/JupyterNotebook/Pandas, Adobe Illustator, Excel
︎ Prototype | ︎︎︎ Product Design
Instructor: Alex Krieger, Andres Sevtsuk
Tools: ArcGIS, Python/JupyterNotebook/Pandas, Adobe Illustator, Excel
︎ Prototype | ︎︎︎ Product Design
> Can we improve pedestrian experiences
by offering them alternative routes?
Description
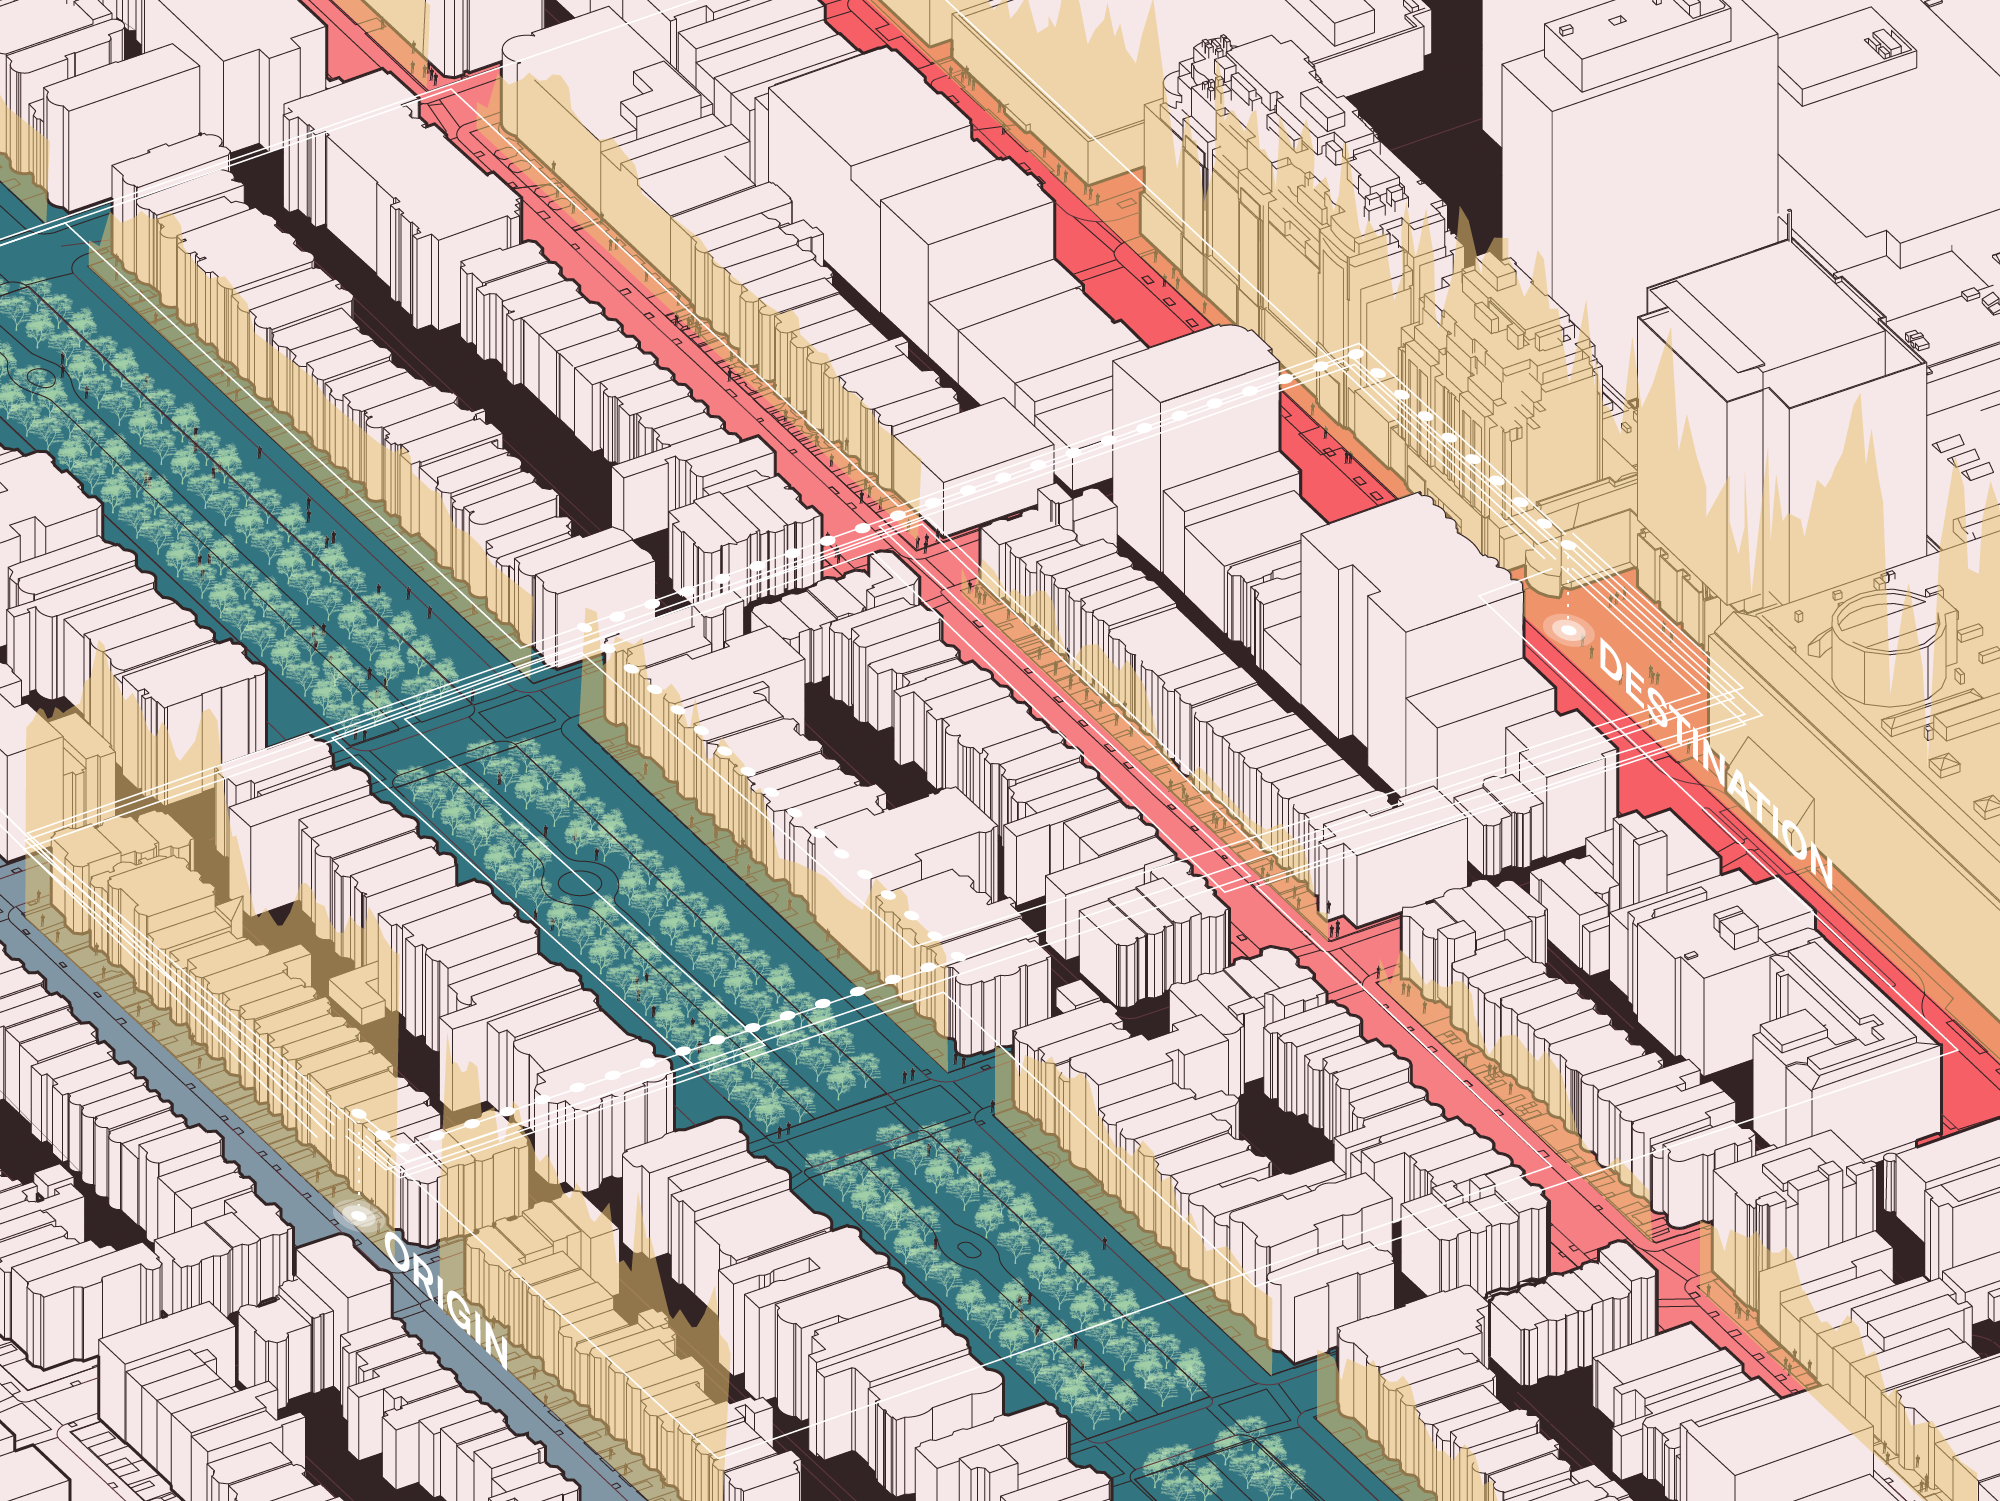
This project demonstrates the way of enriching the pedestrian experience by designing the journey based on individual preferences. The research started with understanding pedestrian behavior and modifying their habits by offering alternatives, and it suggests playful options that enable people to explore the city based on individual criteria. By designing a walking experience within the existing infrastructure of the cities, this system re-shapes the journey into a more joyous one.
The journey thus becomes more than a way to arrive somewhere; it becomes a destination itself.
Background Research
| Human Decision-making Process |
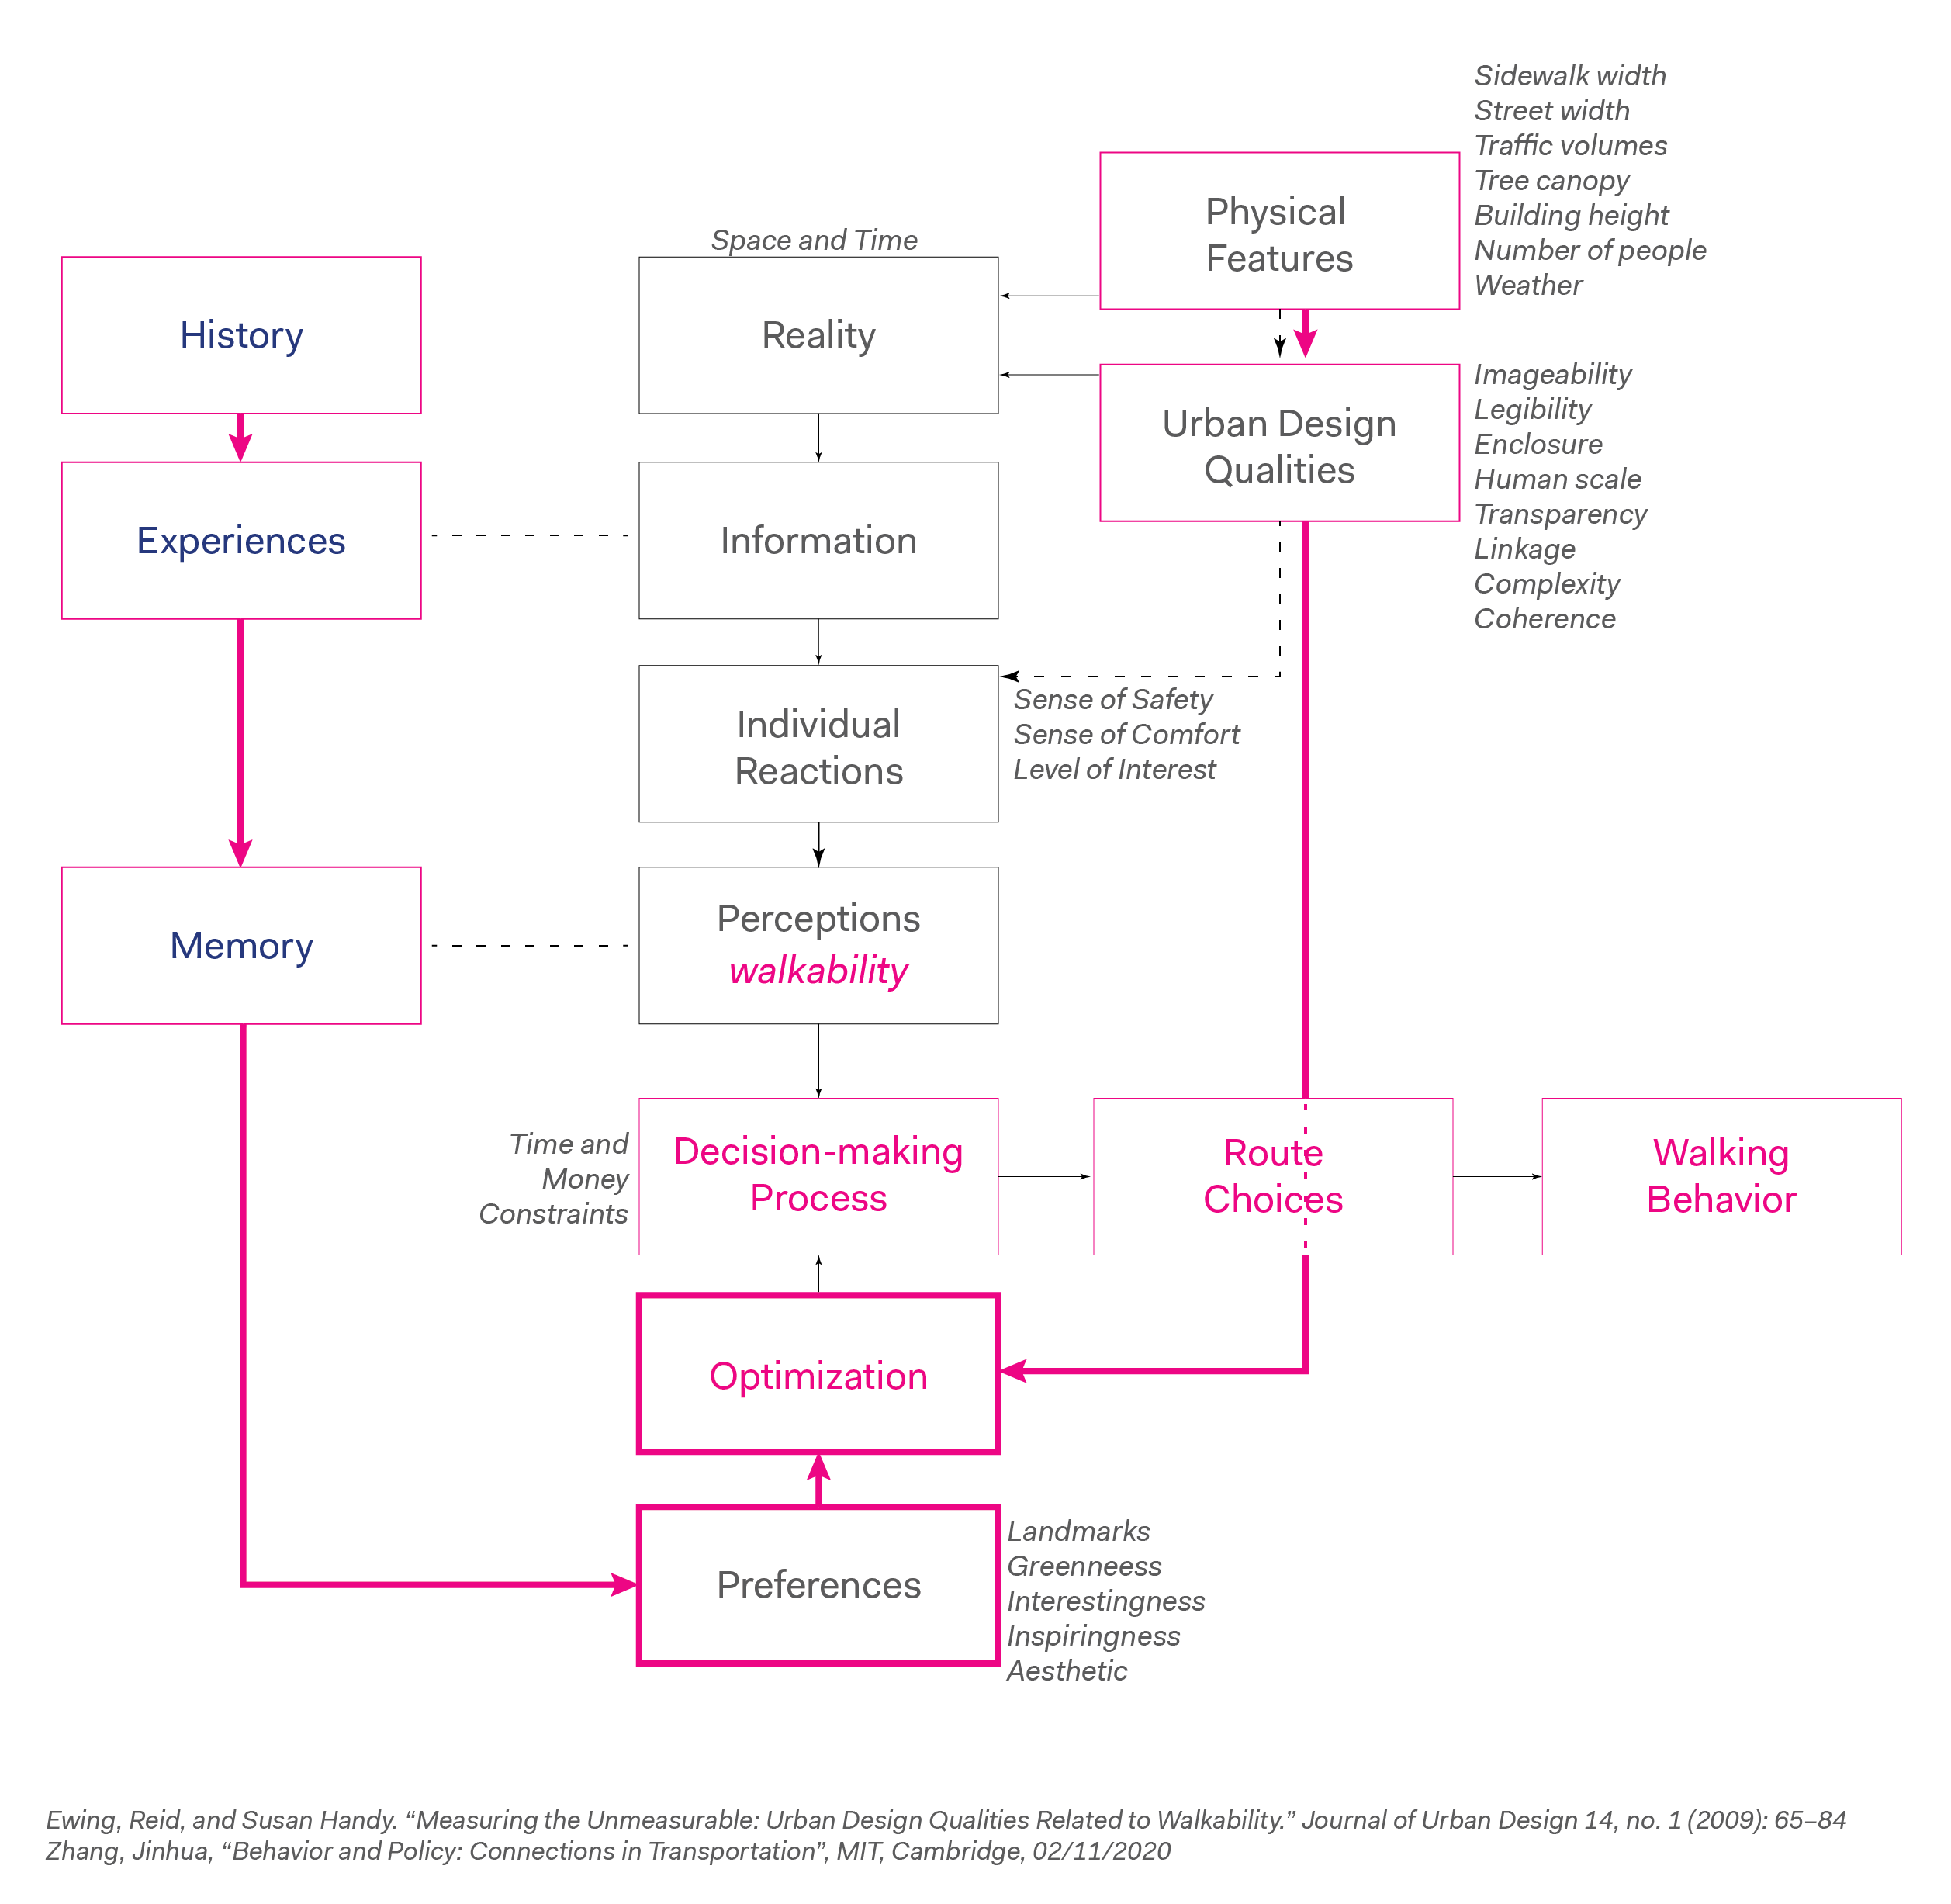
| Bounded Rationality Theory |
According to bounded rationality theory, it is not feasible to make a perfect economic decision due to the inadequacy of information people can gather and compute. Rather, people make their choices based on their preferences and perception from their own experiences.
Questions
to offer optimized routes for a better walking experience,
- How far are people willing to walk more?
-
How do we determine which route is better than the others?
- How do we provide this information to users?
Efficiency
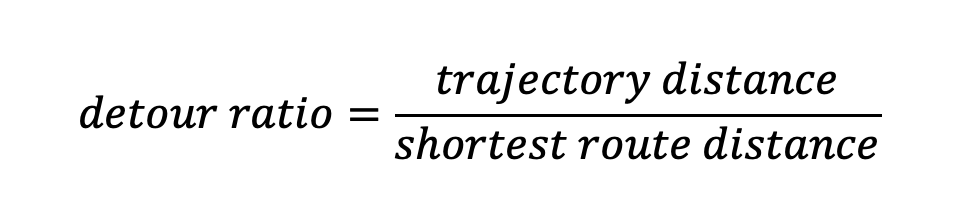
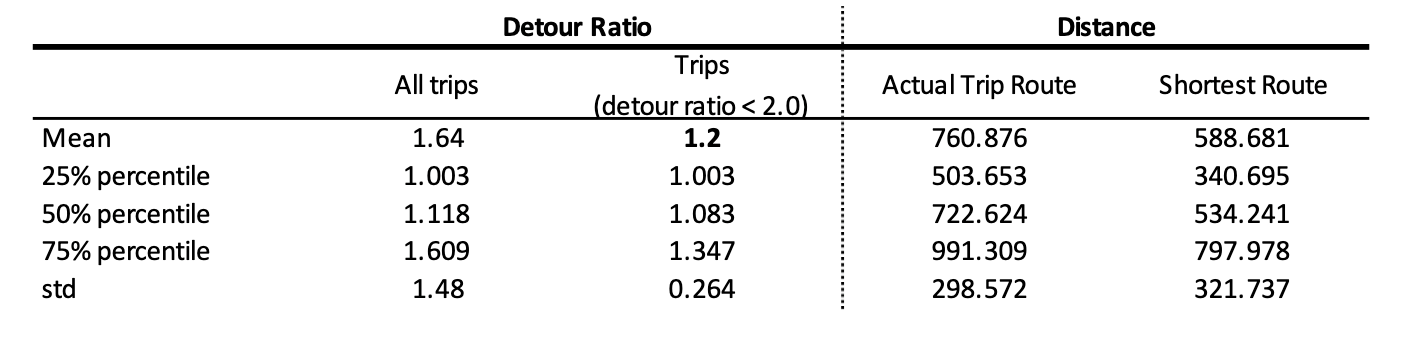
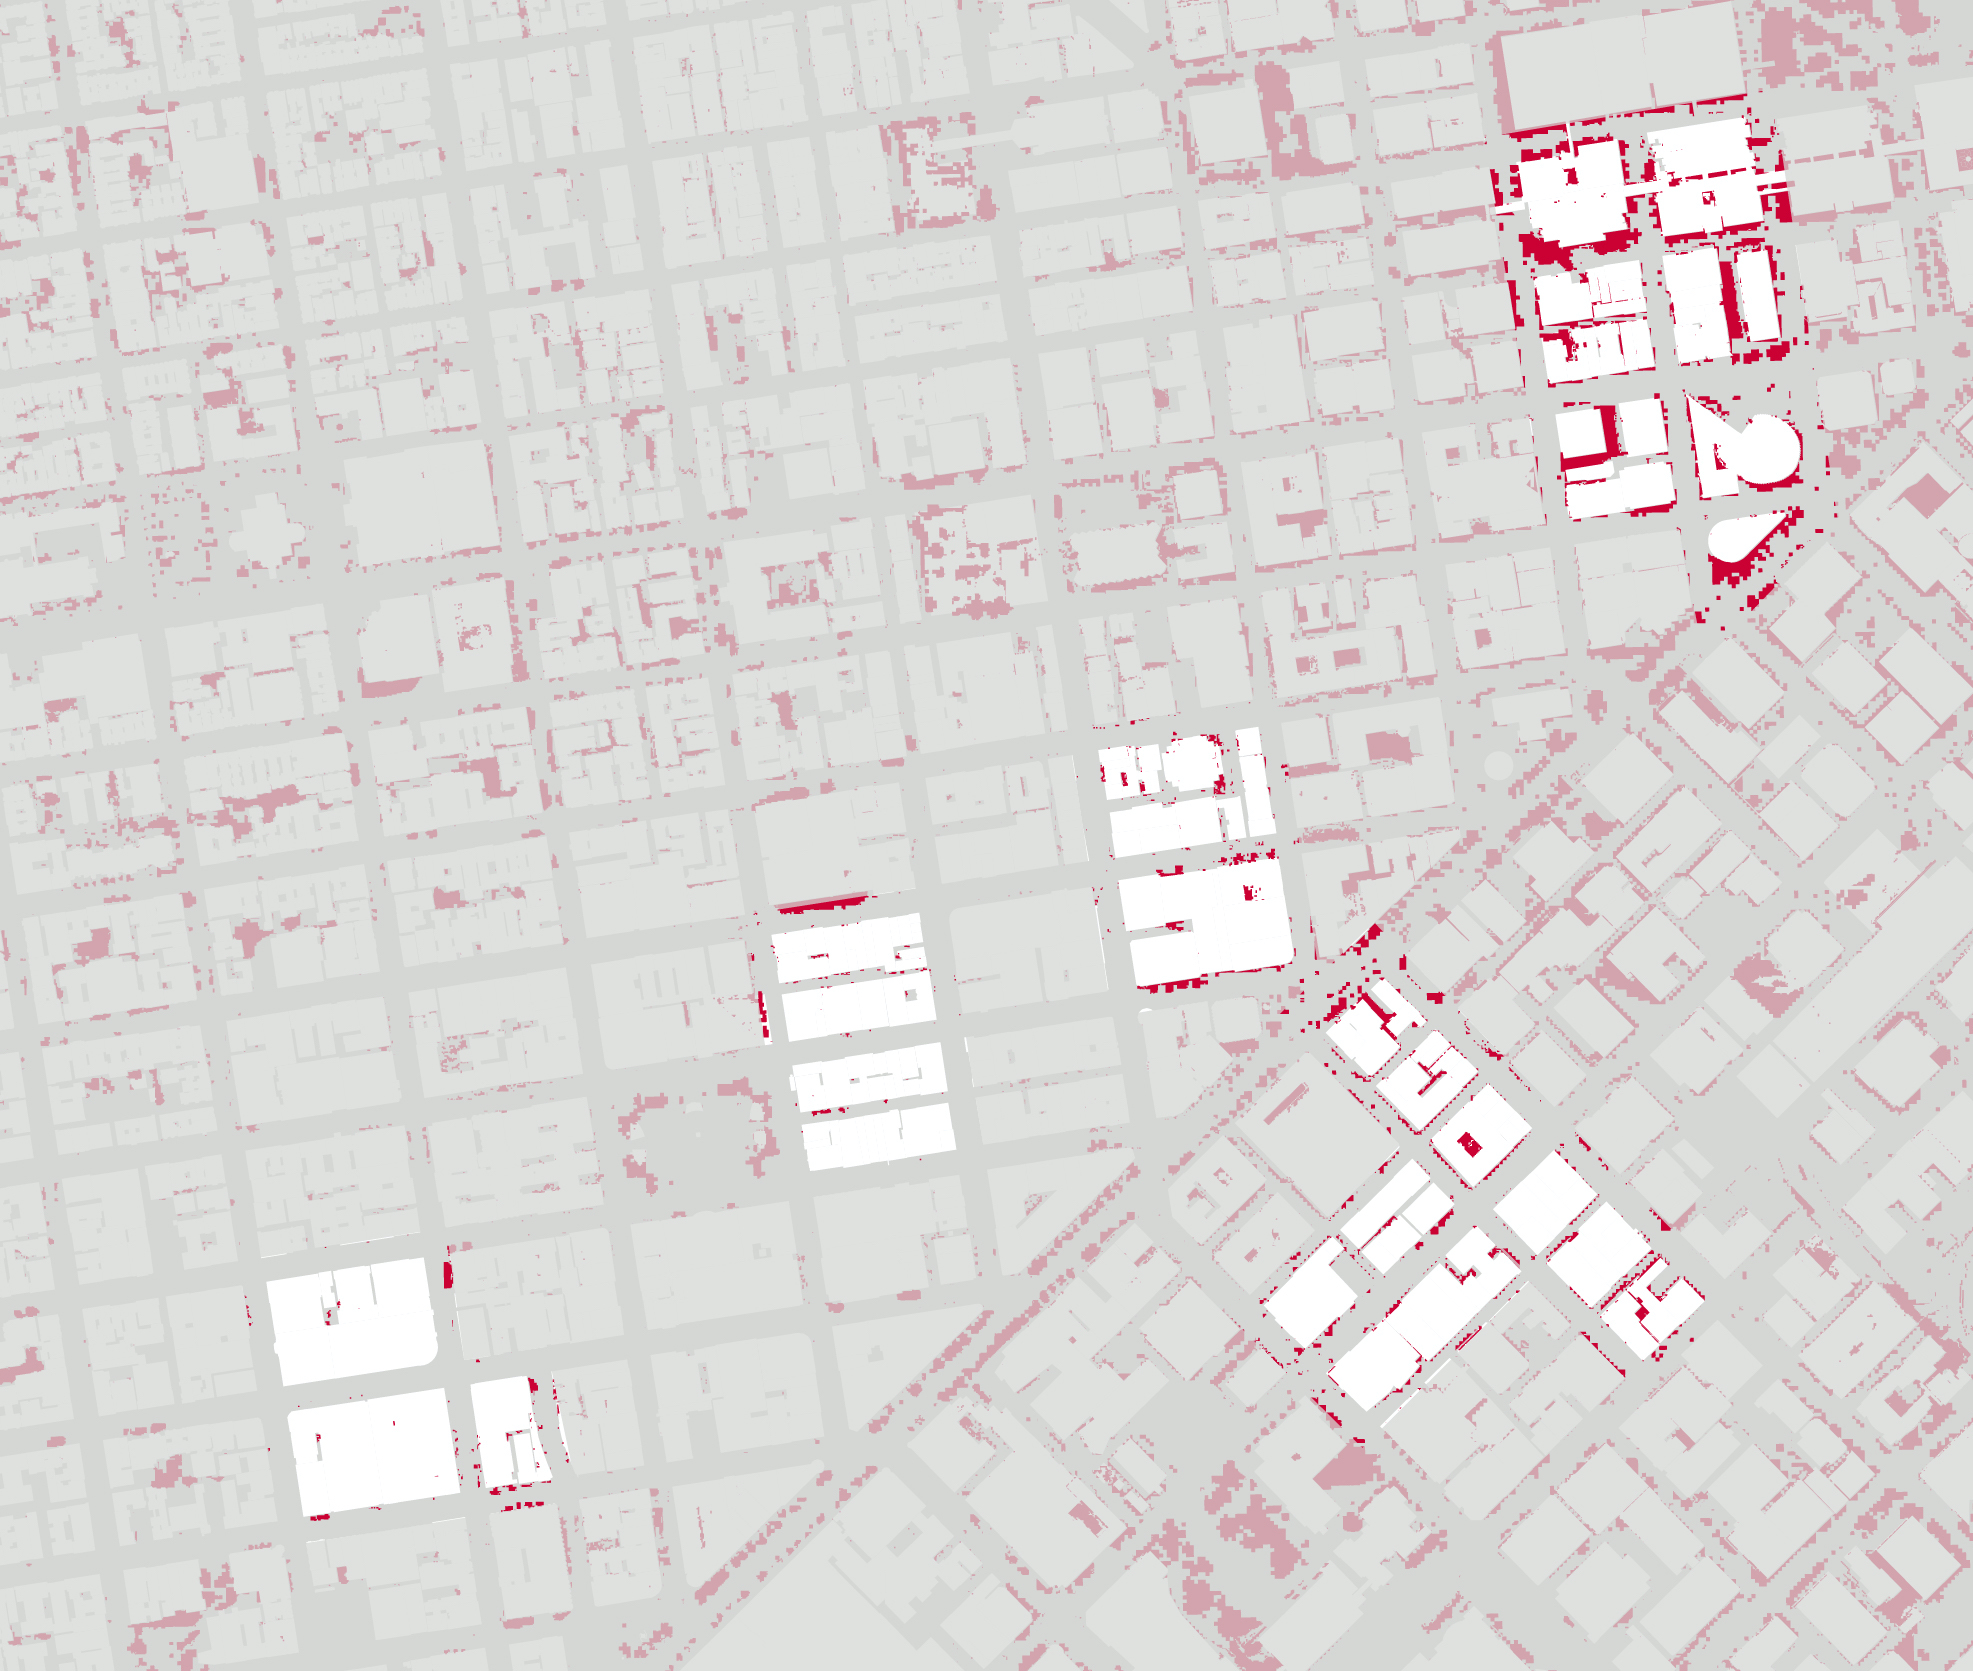
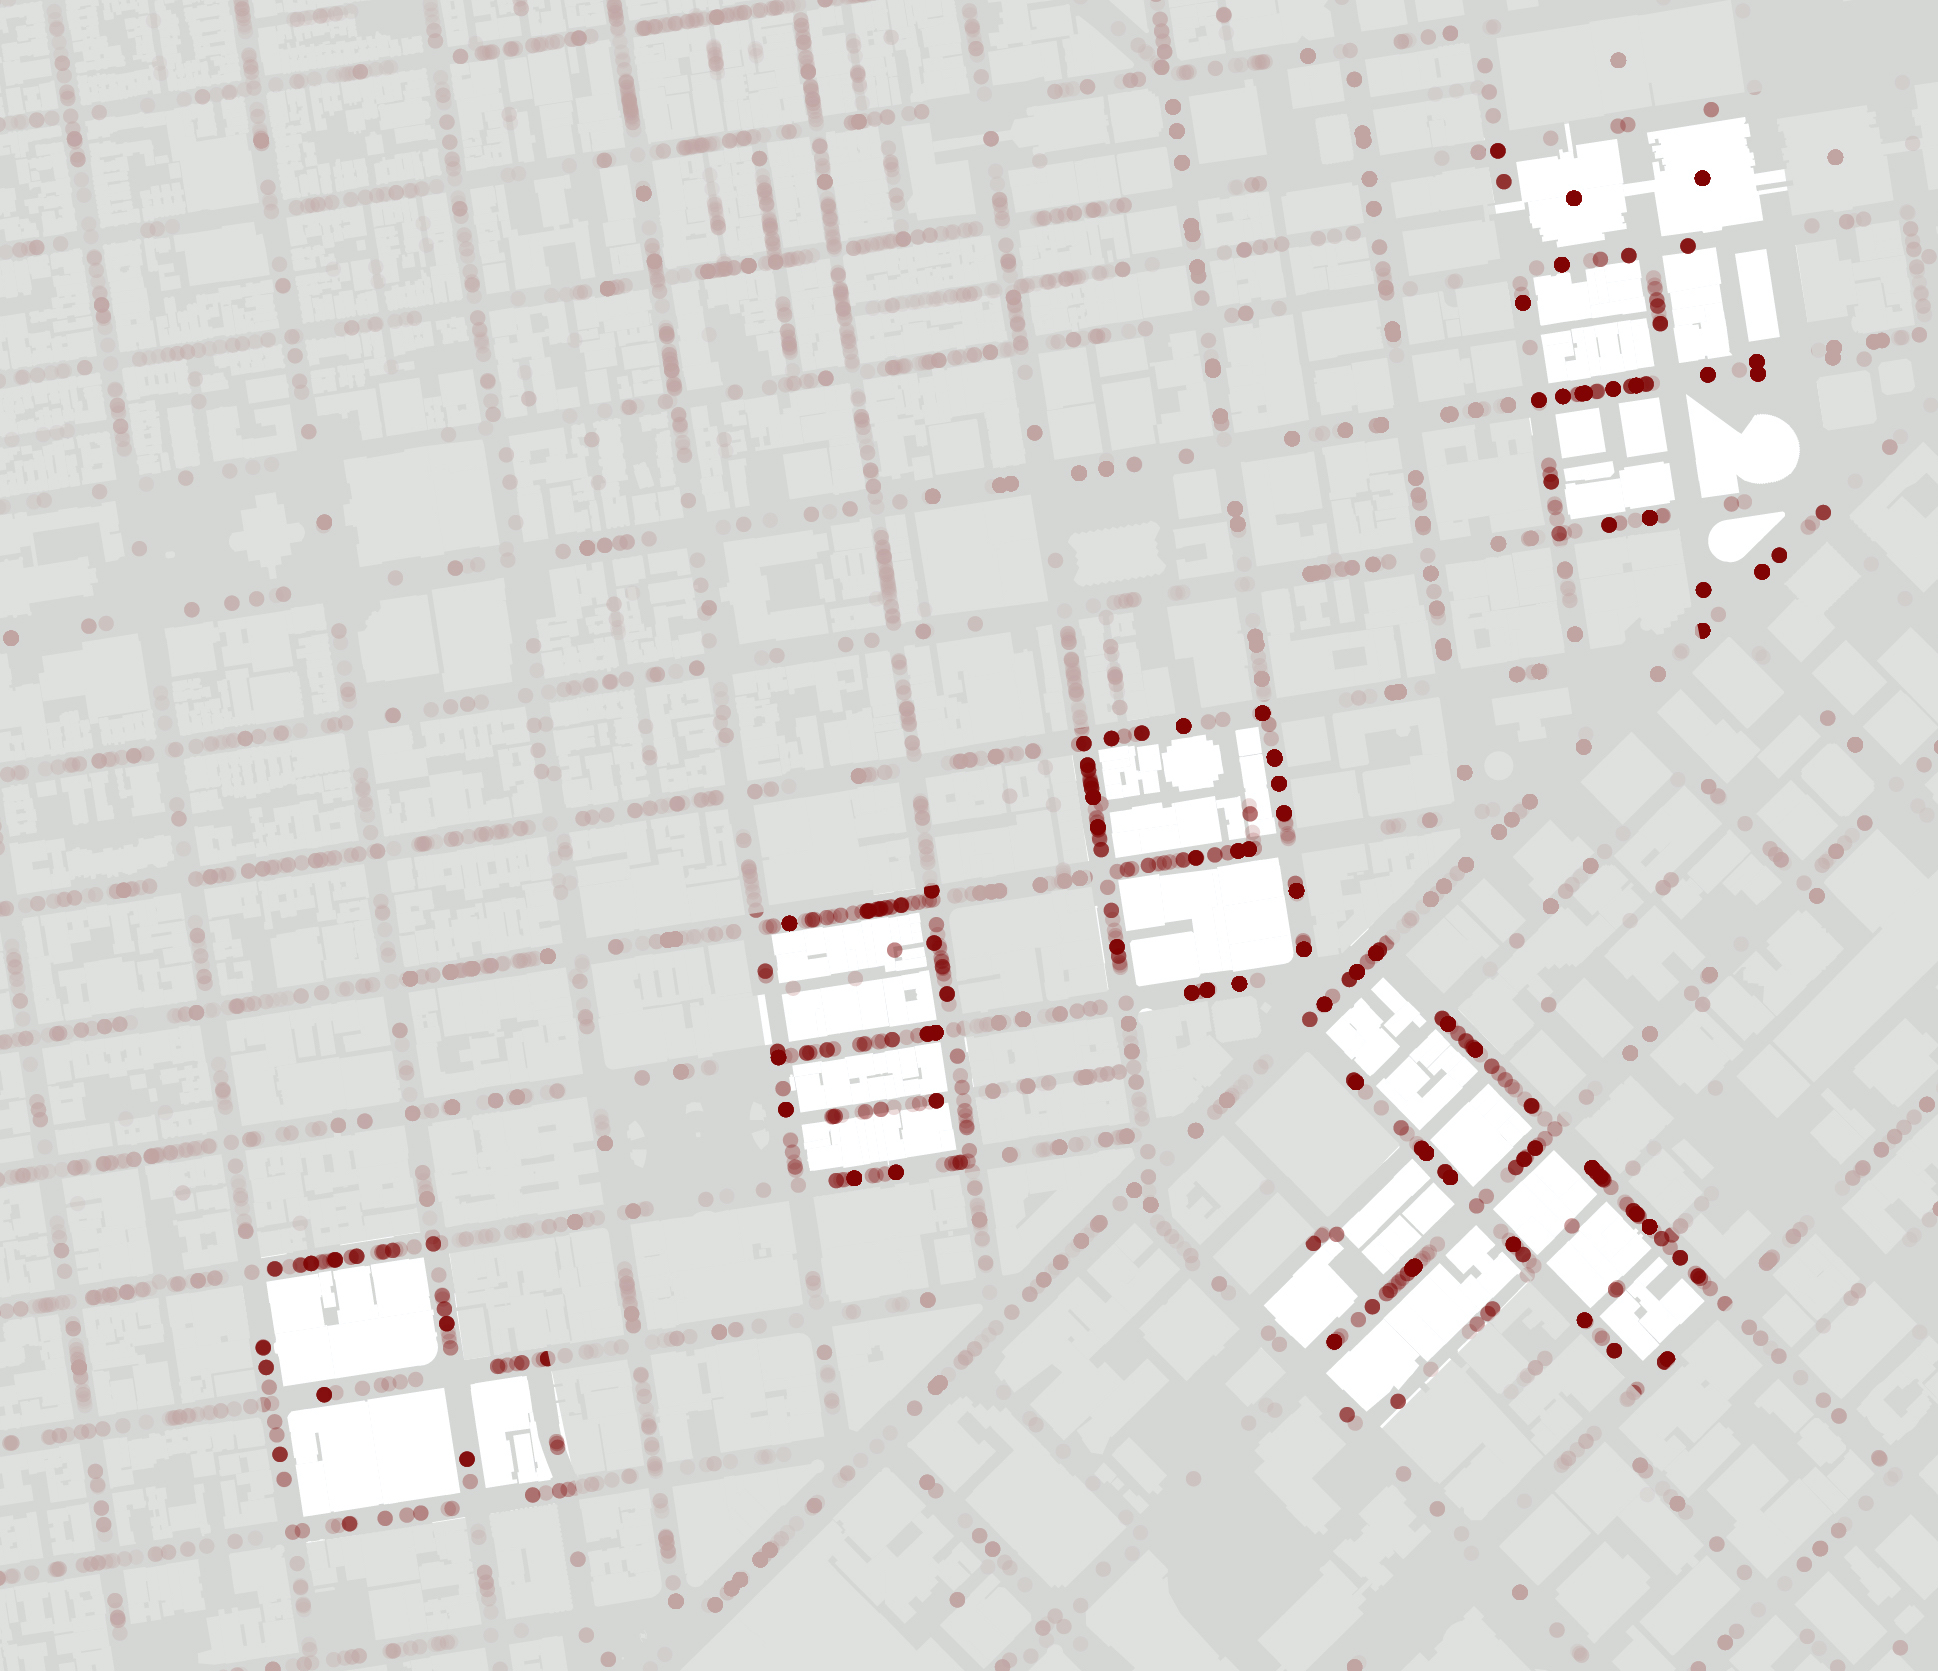
Detour Ratio Analysis
A detour ratio analysis was conducted to understand the current behavior of pedestrians regarding how far they walk versus the shortest route. The detour ratio, the percentage that people detour from the shortest route, was calculated from a sample of 22,636 pedestrian trajectories in San Francisco.
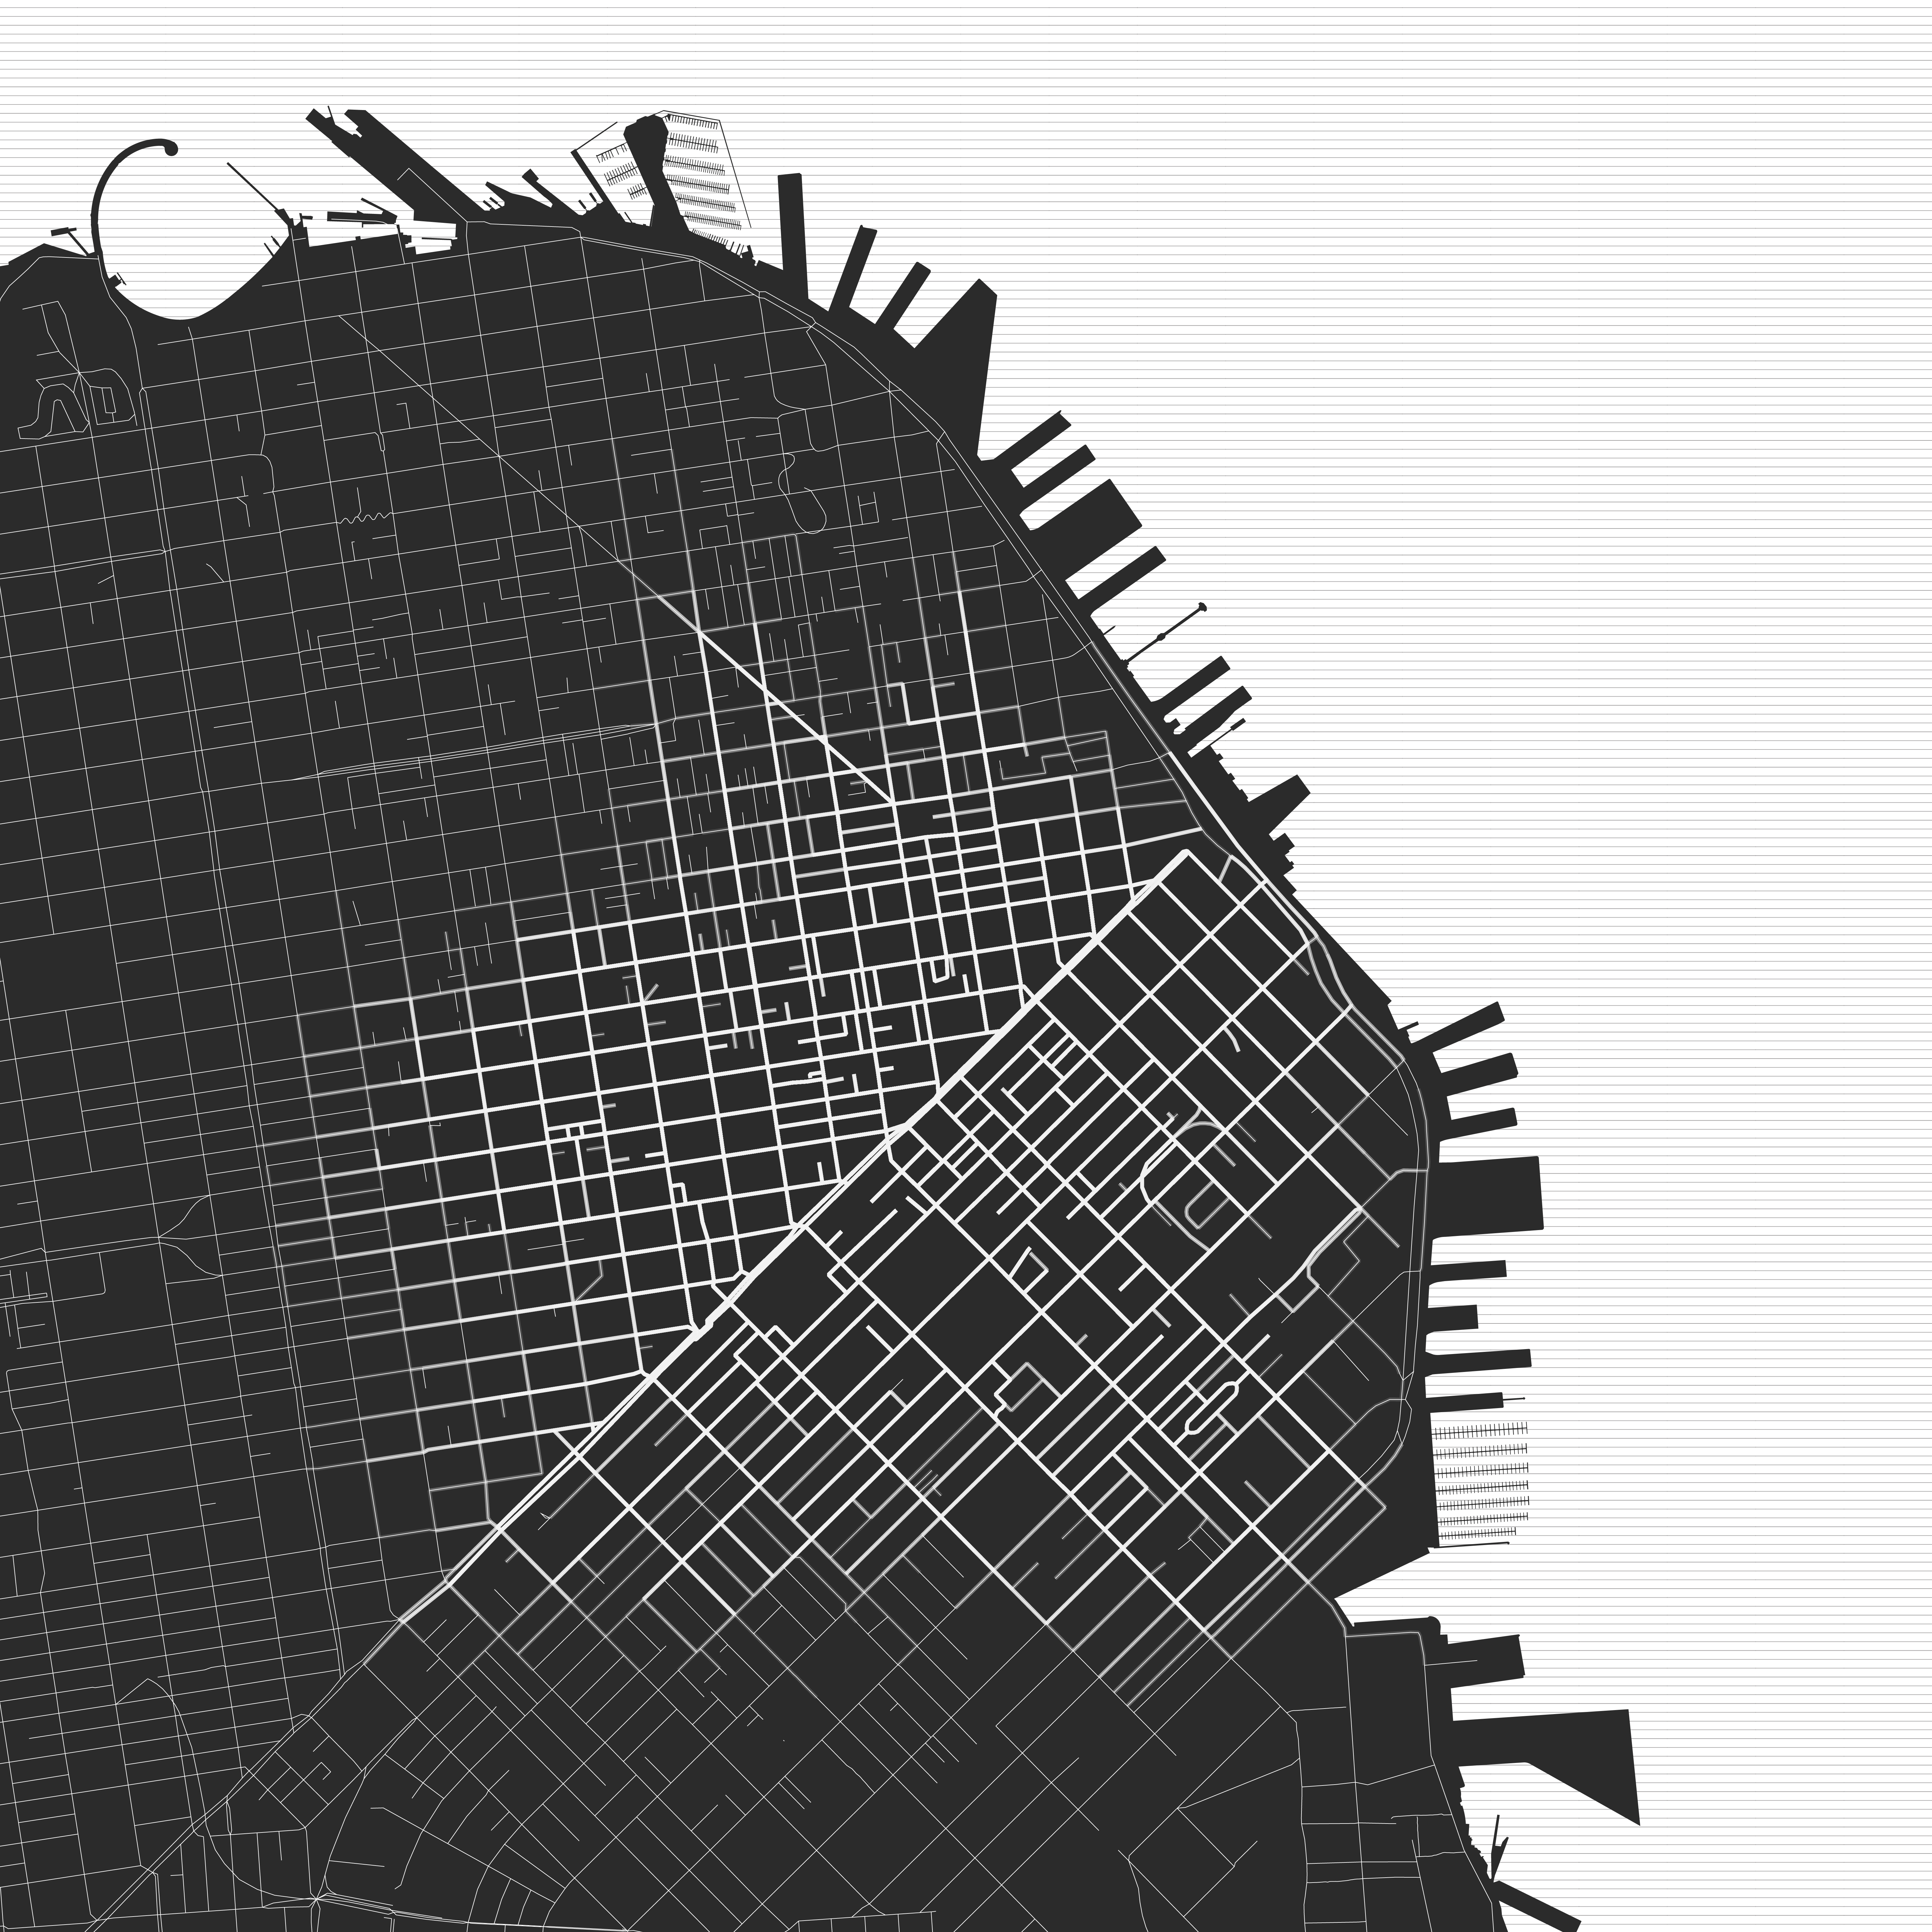 22,636 Pedestrian Trajectories in San Francisco
Experience
Pedestrian Flow Model
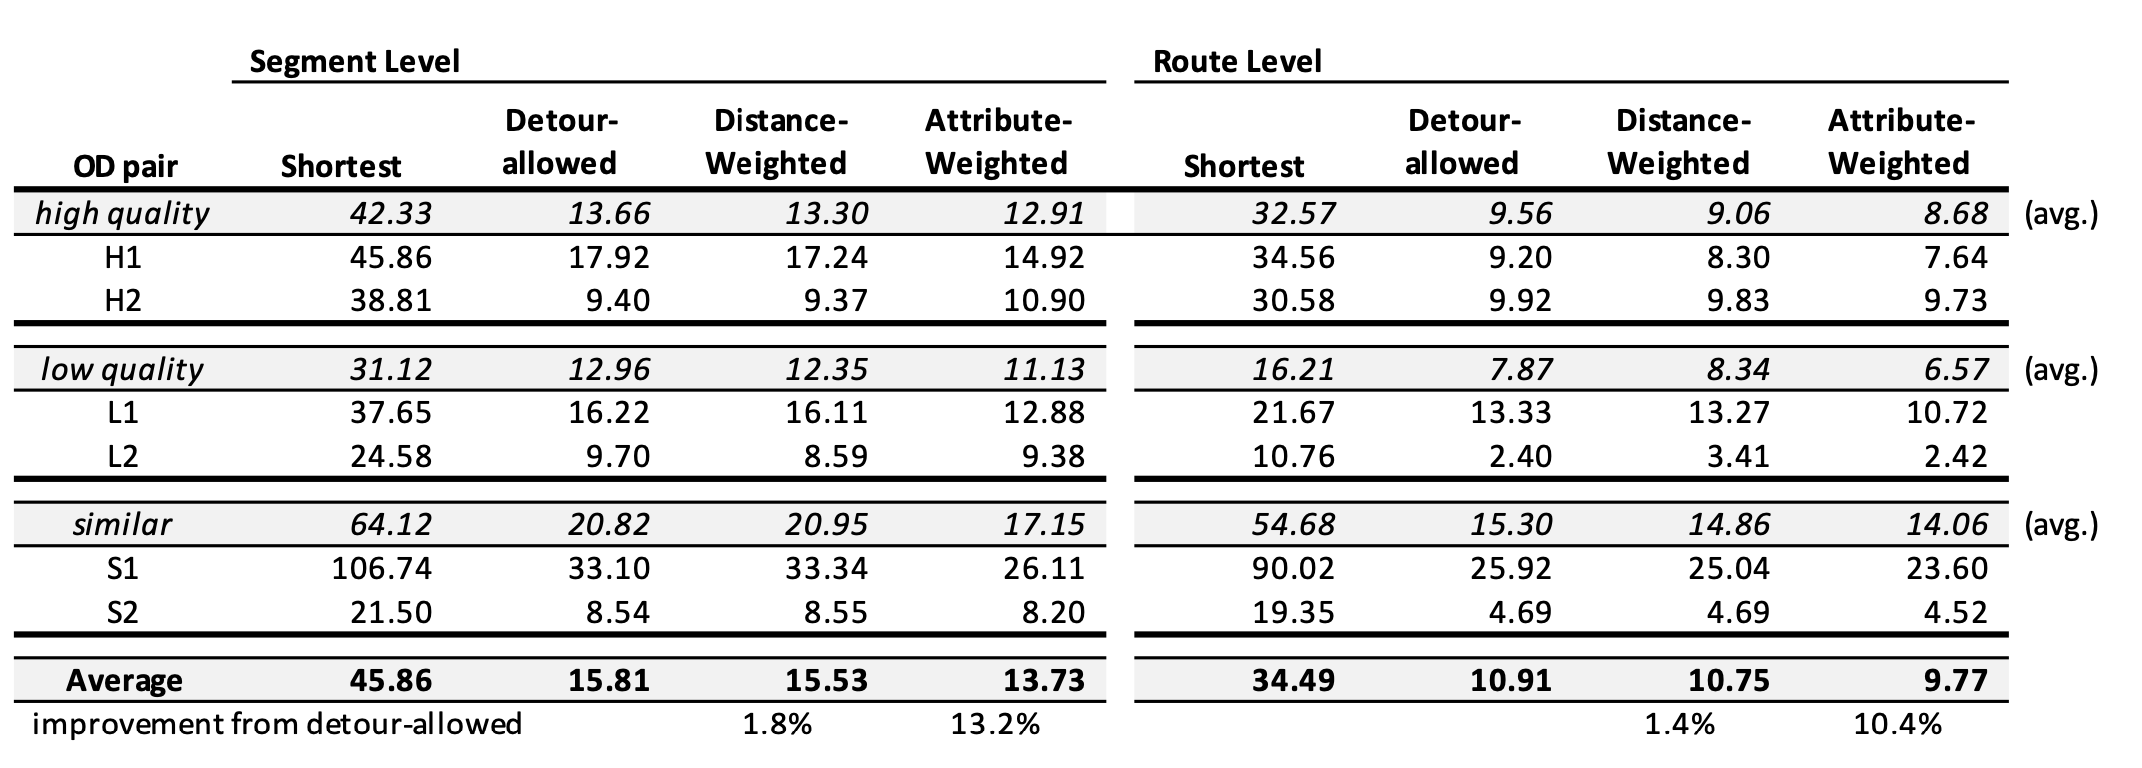
Through the pedestrian flow model analysis, it is demonstrated that pedestrians consider attributes on streets for their route decision-making in addition to considering the distance.
The most preferable route regarding the quality of experience can be measured by calculating ‘perceived distance’.
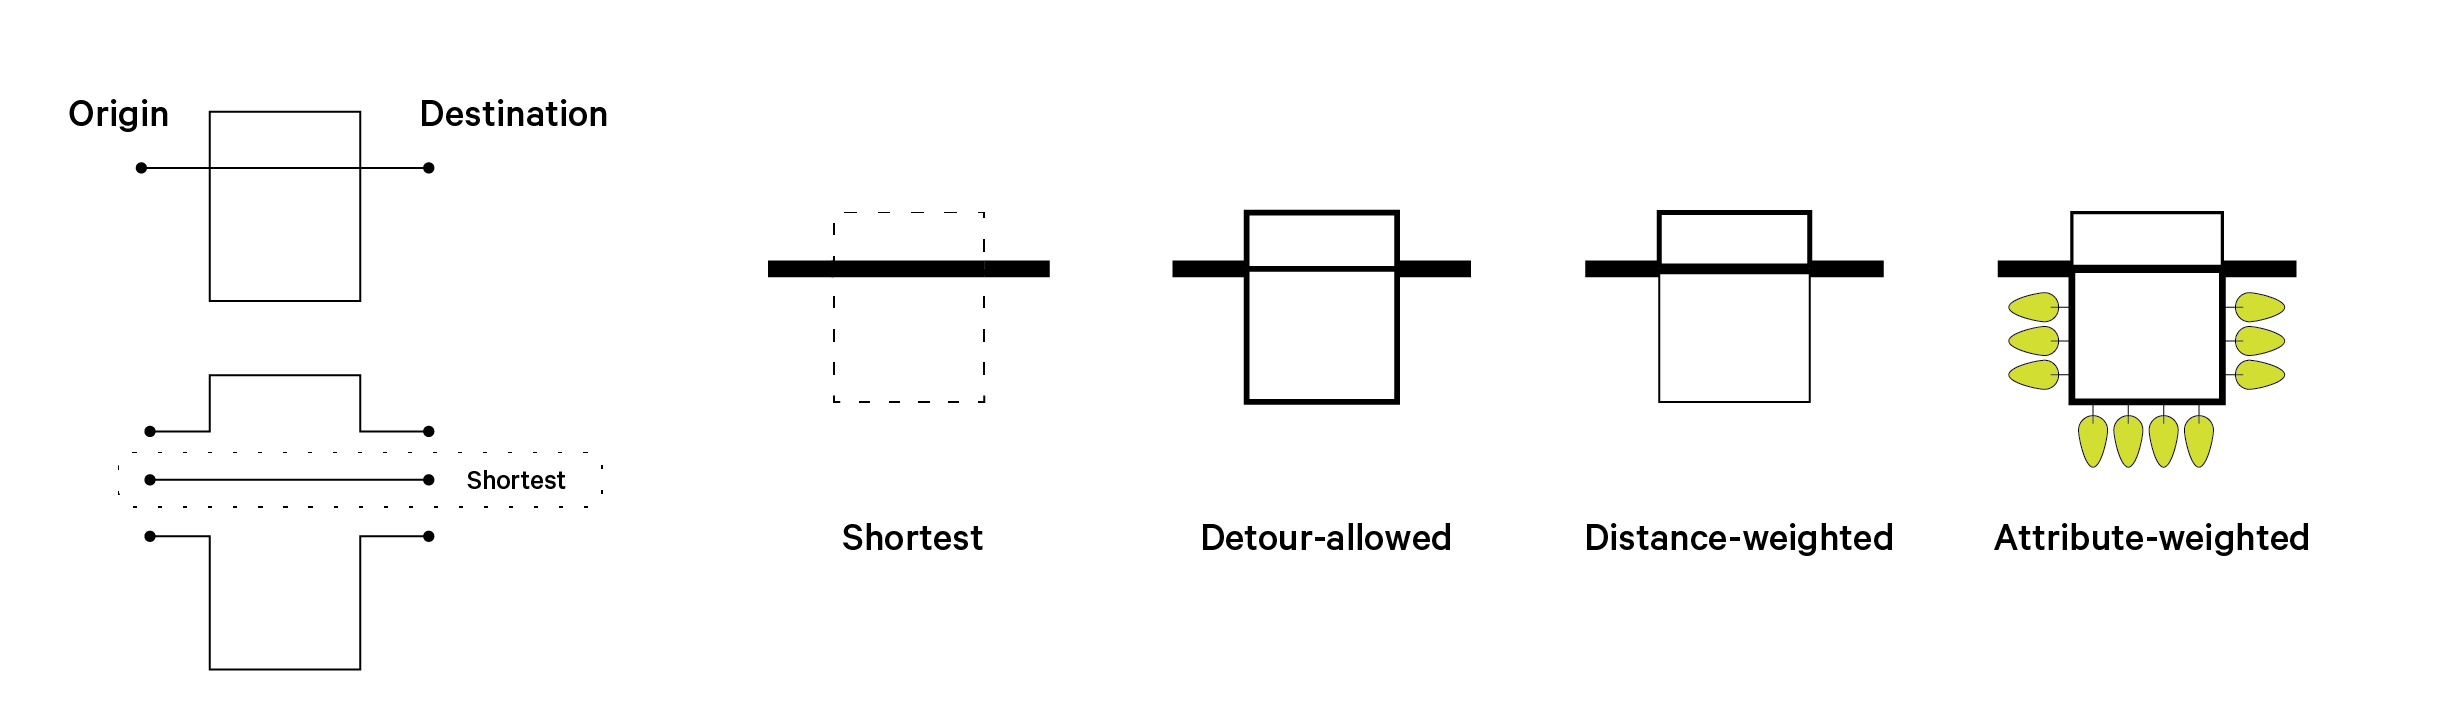
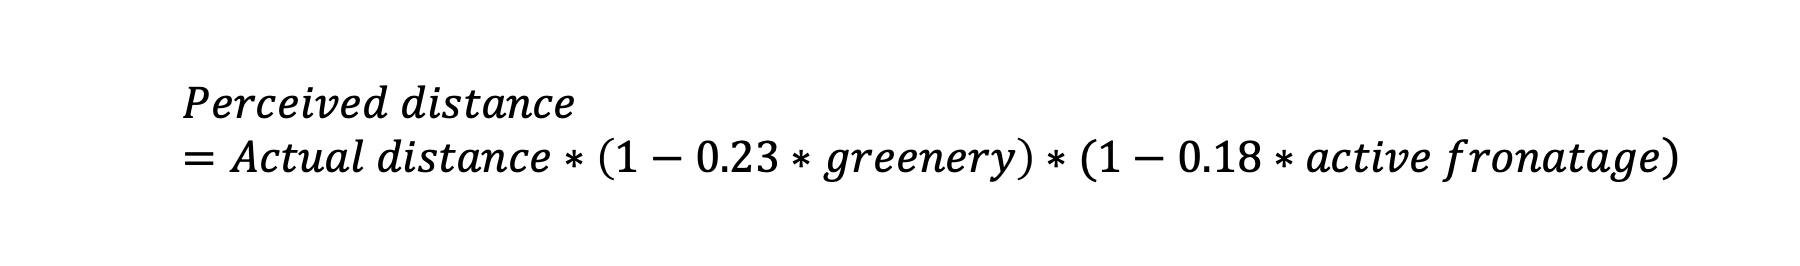
Perceived distance and Actual distance are compared after being calculated according to the tree coverage and the number of amenity on each street.
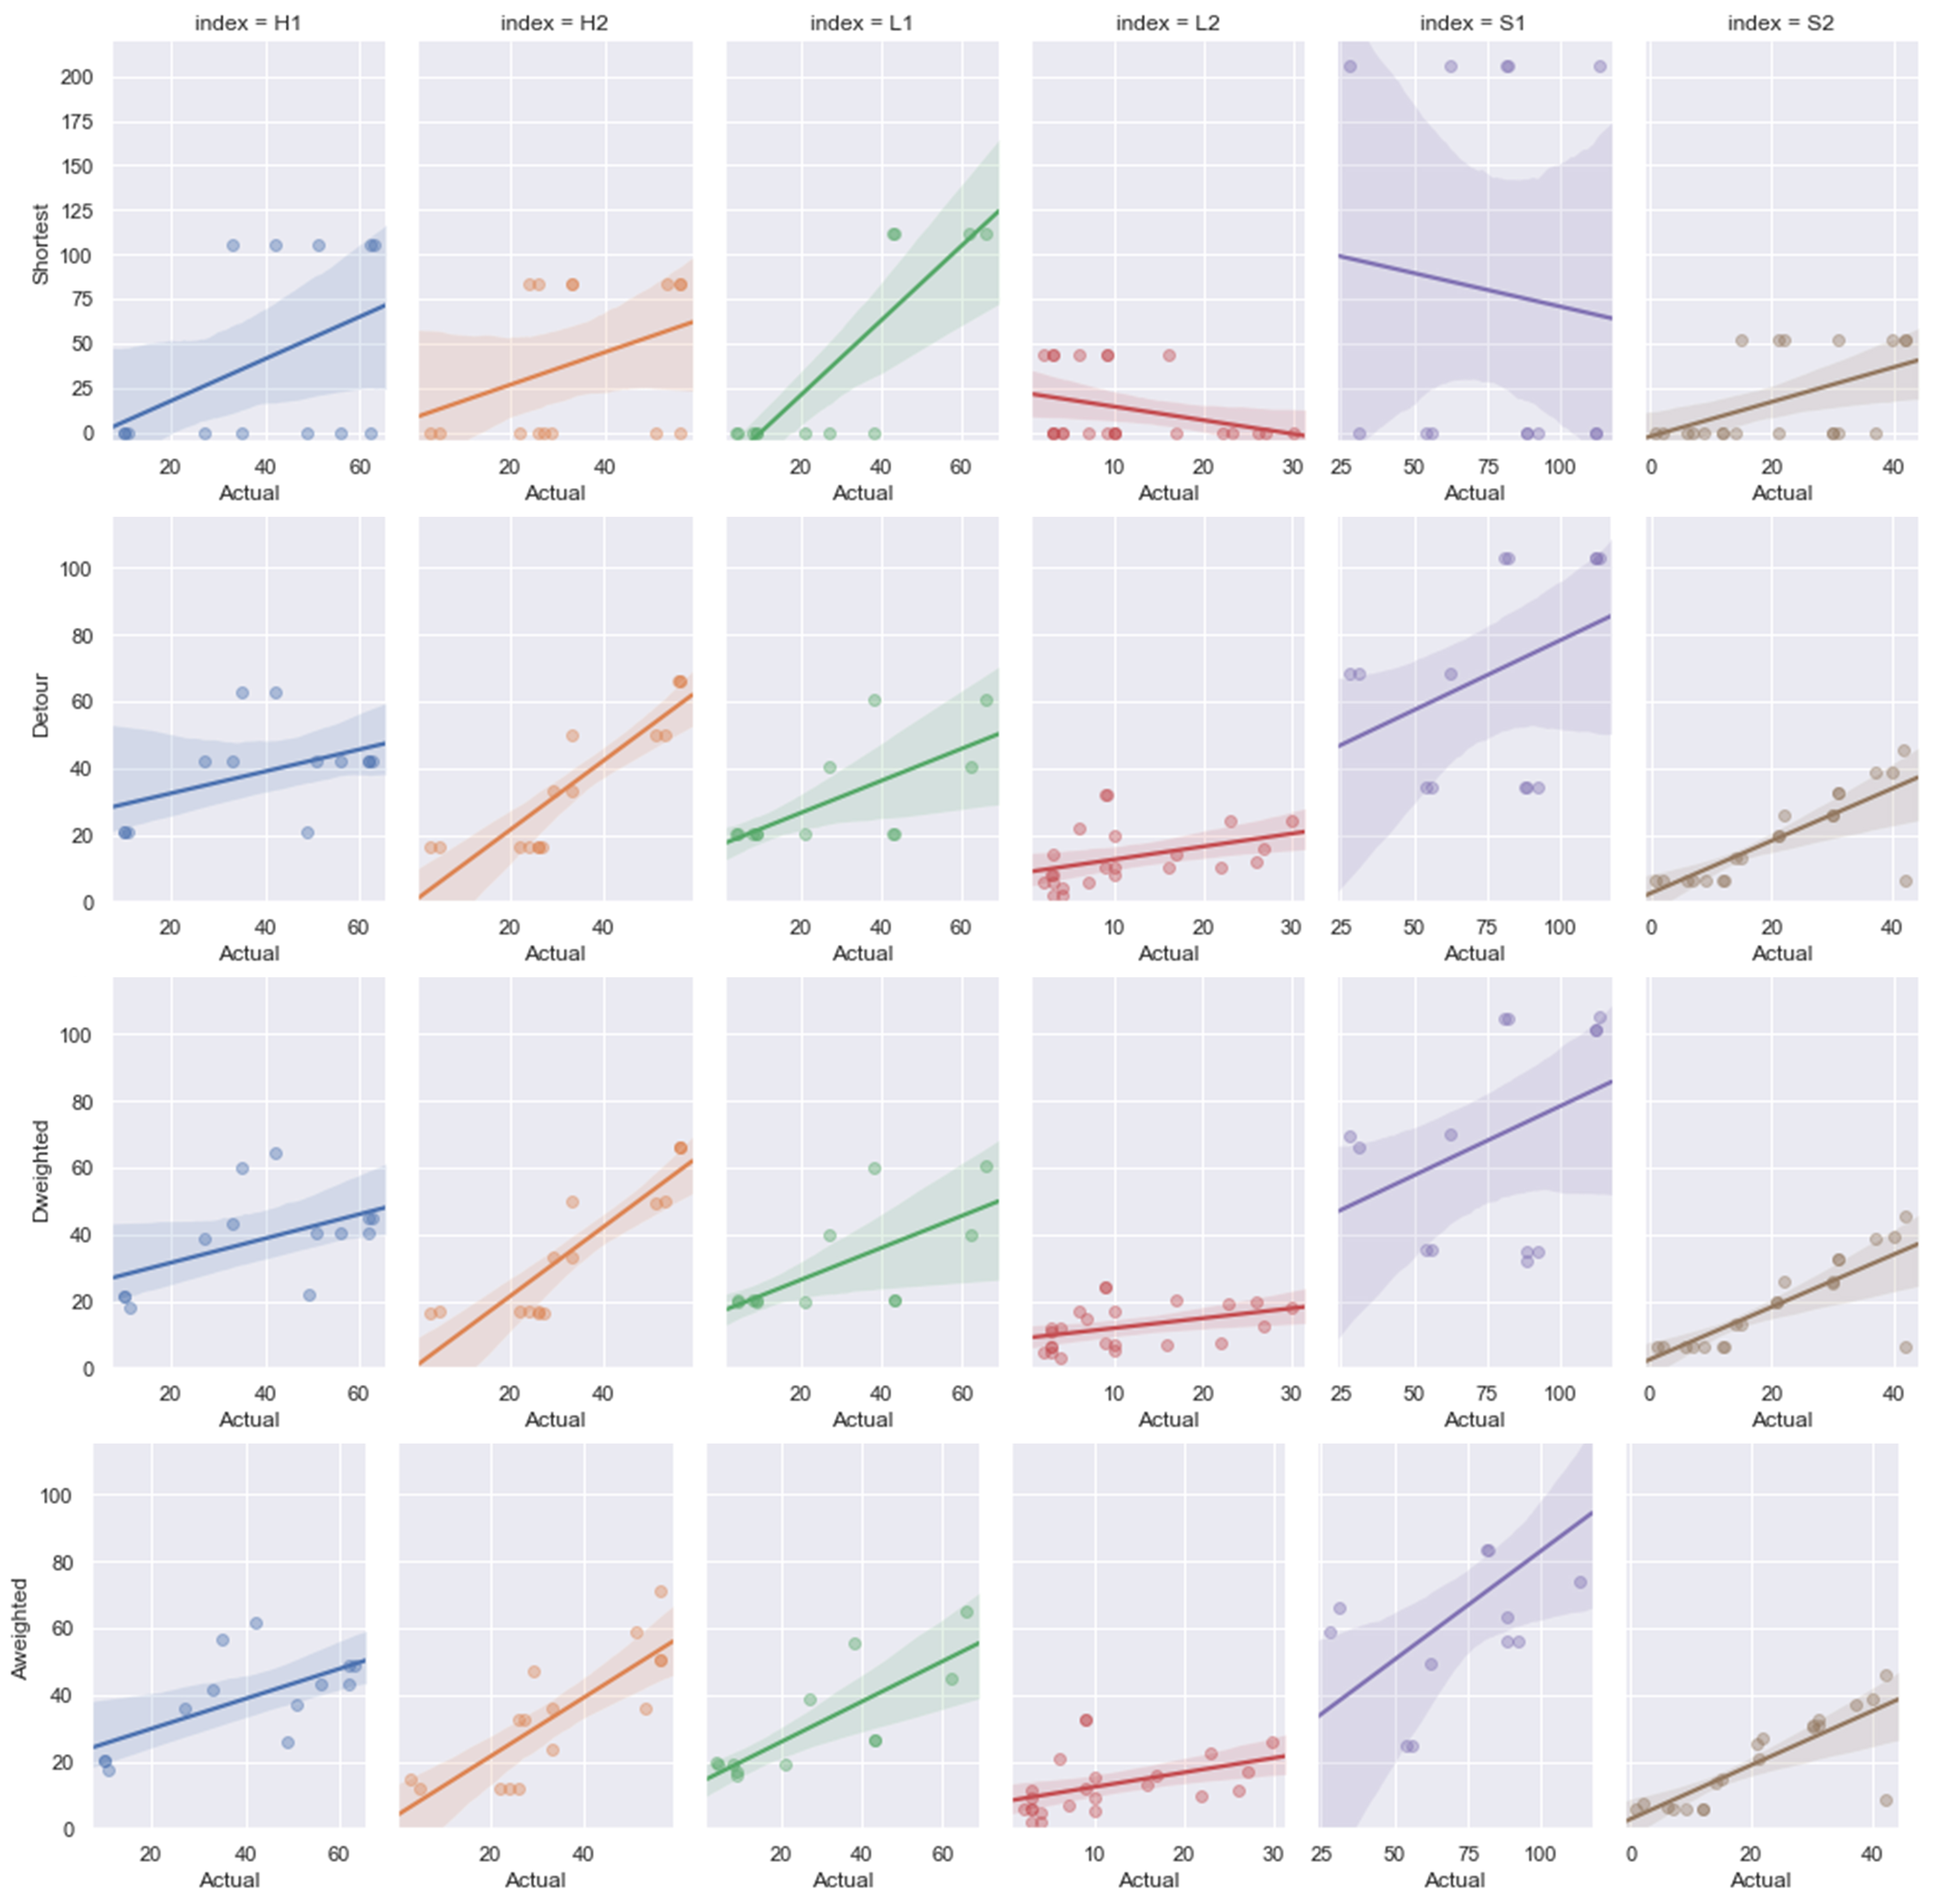
| Overpredicted |
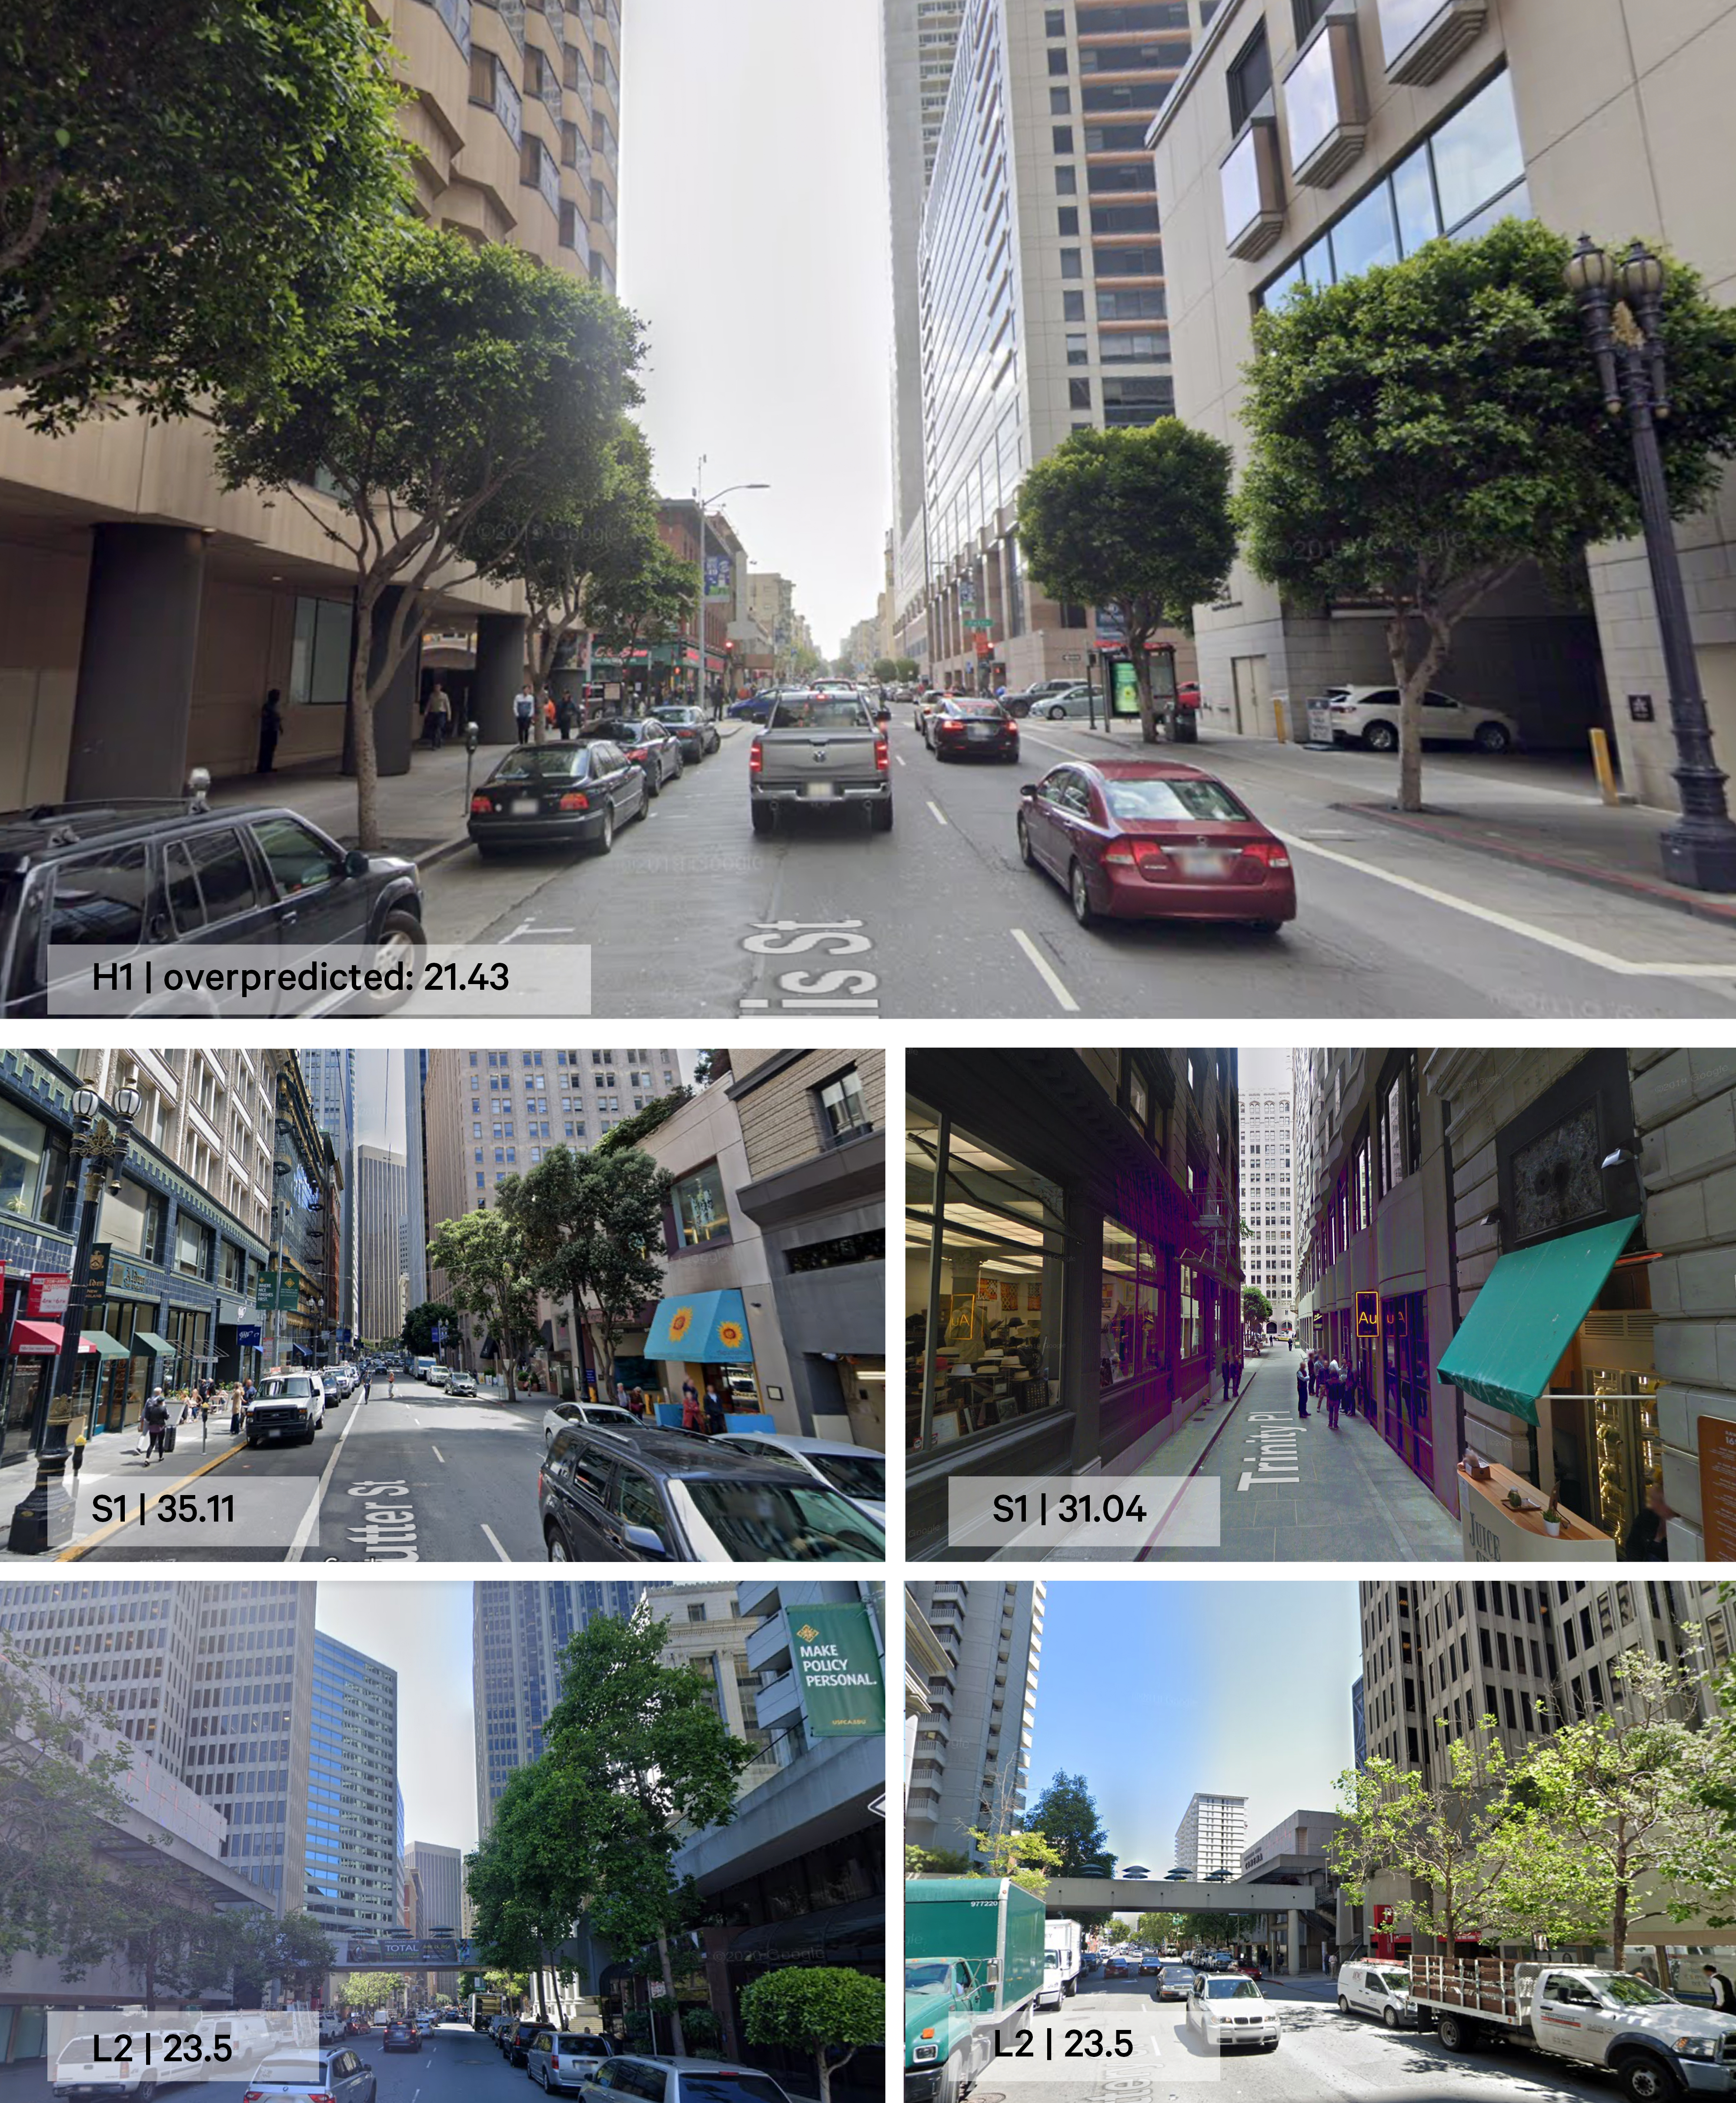
| Underpredicted |
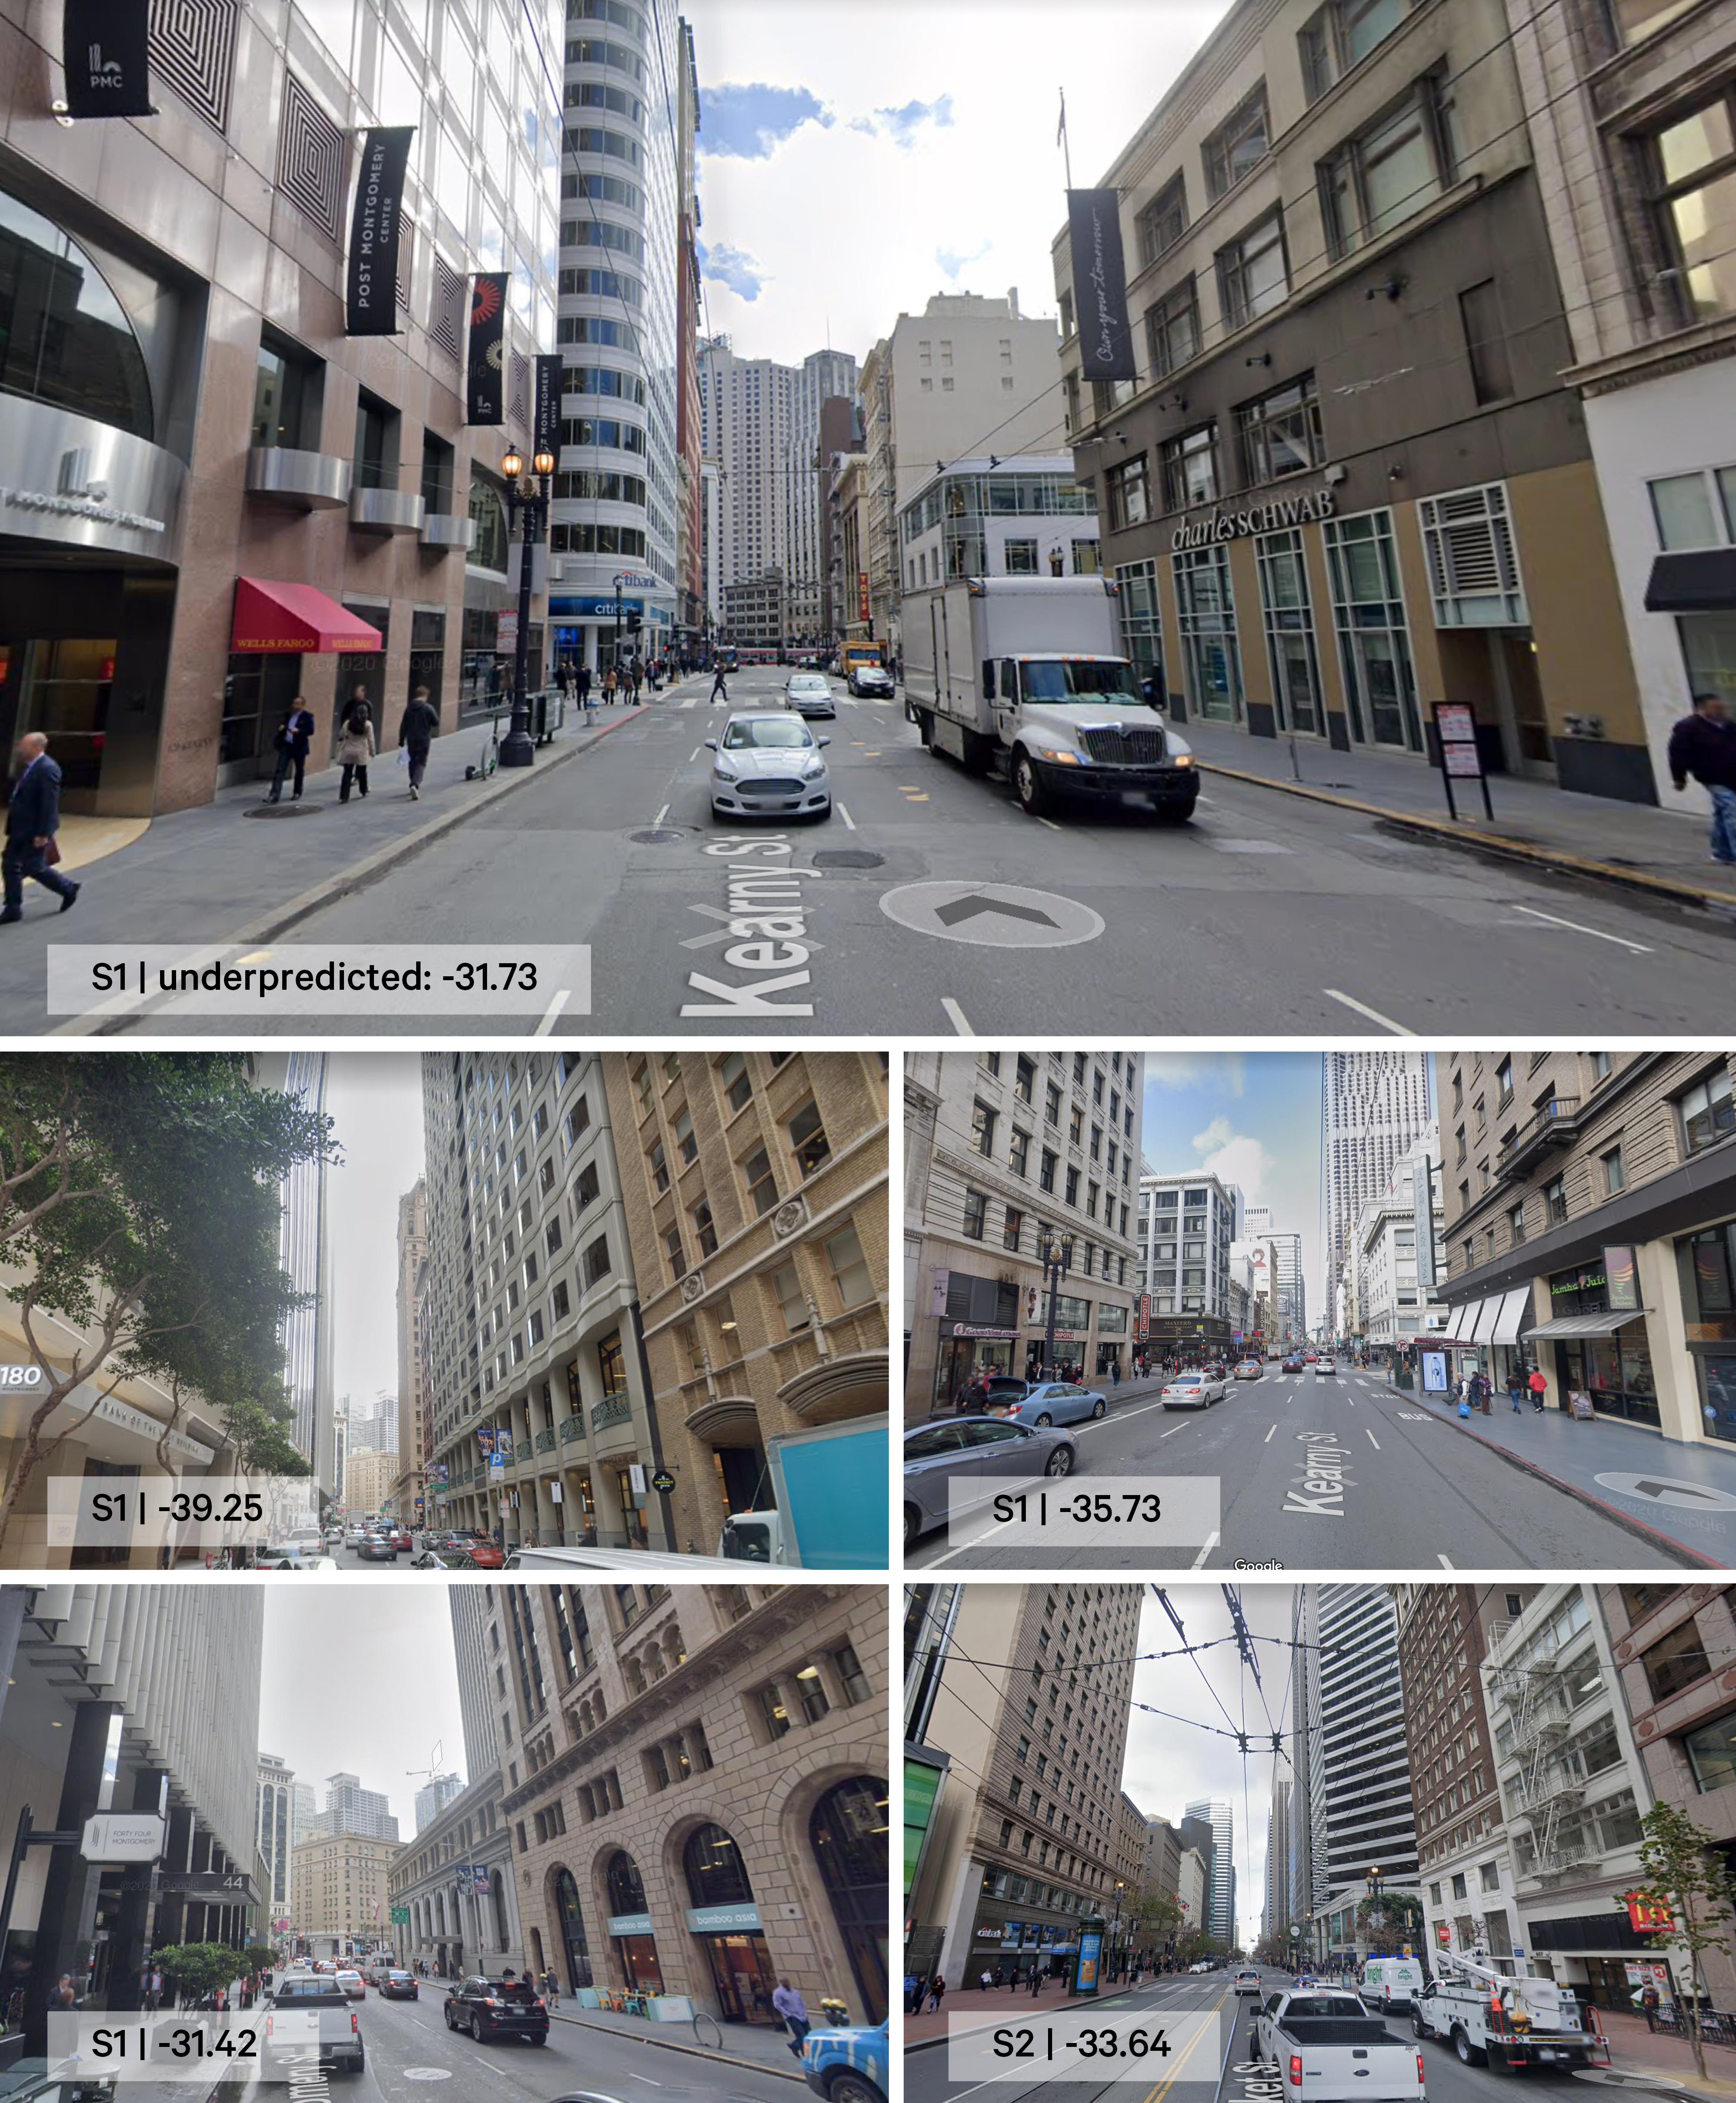
Actual vs. Estimated
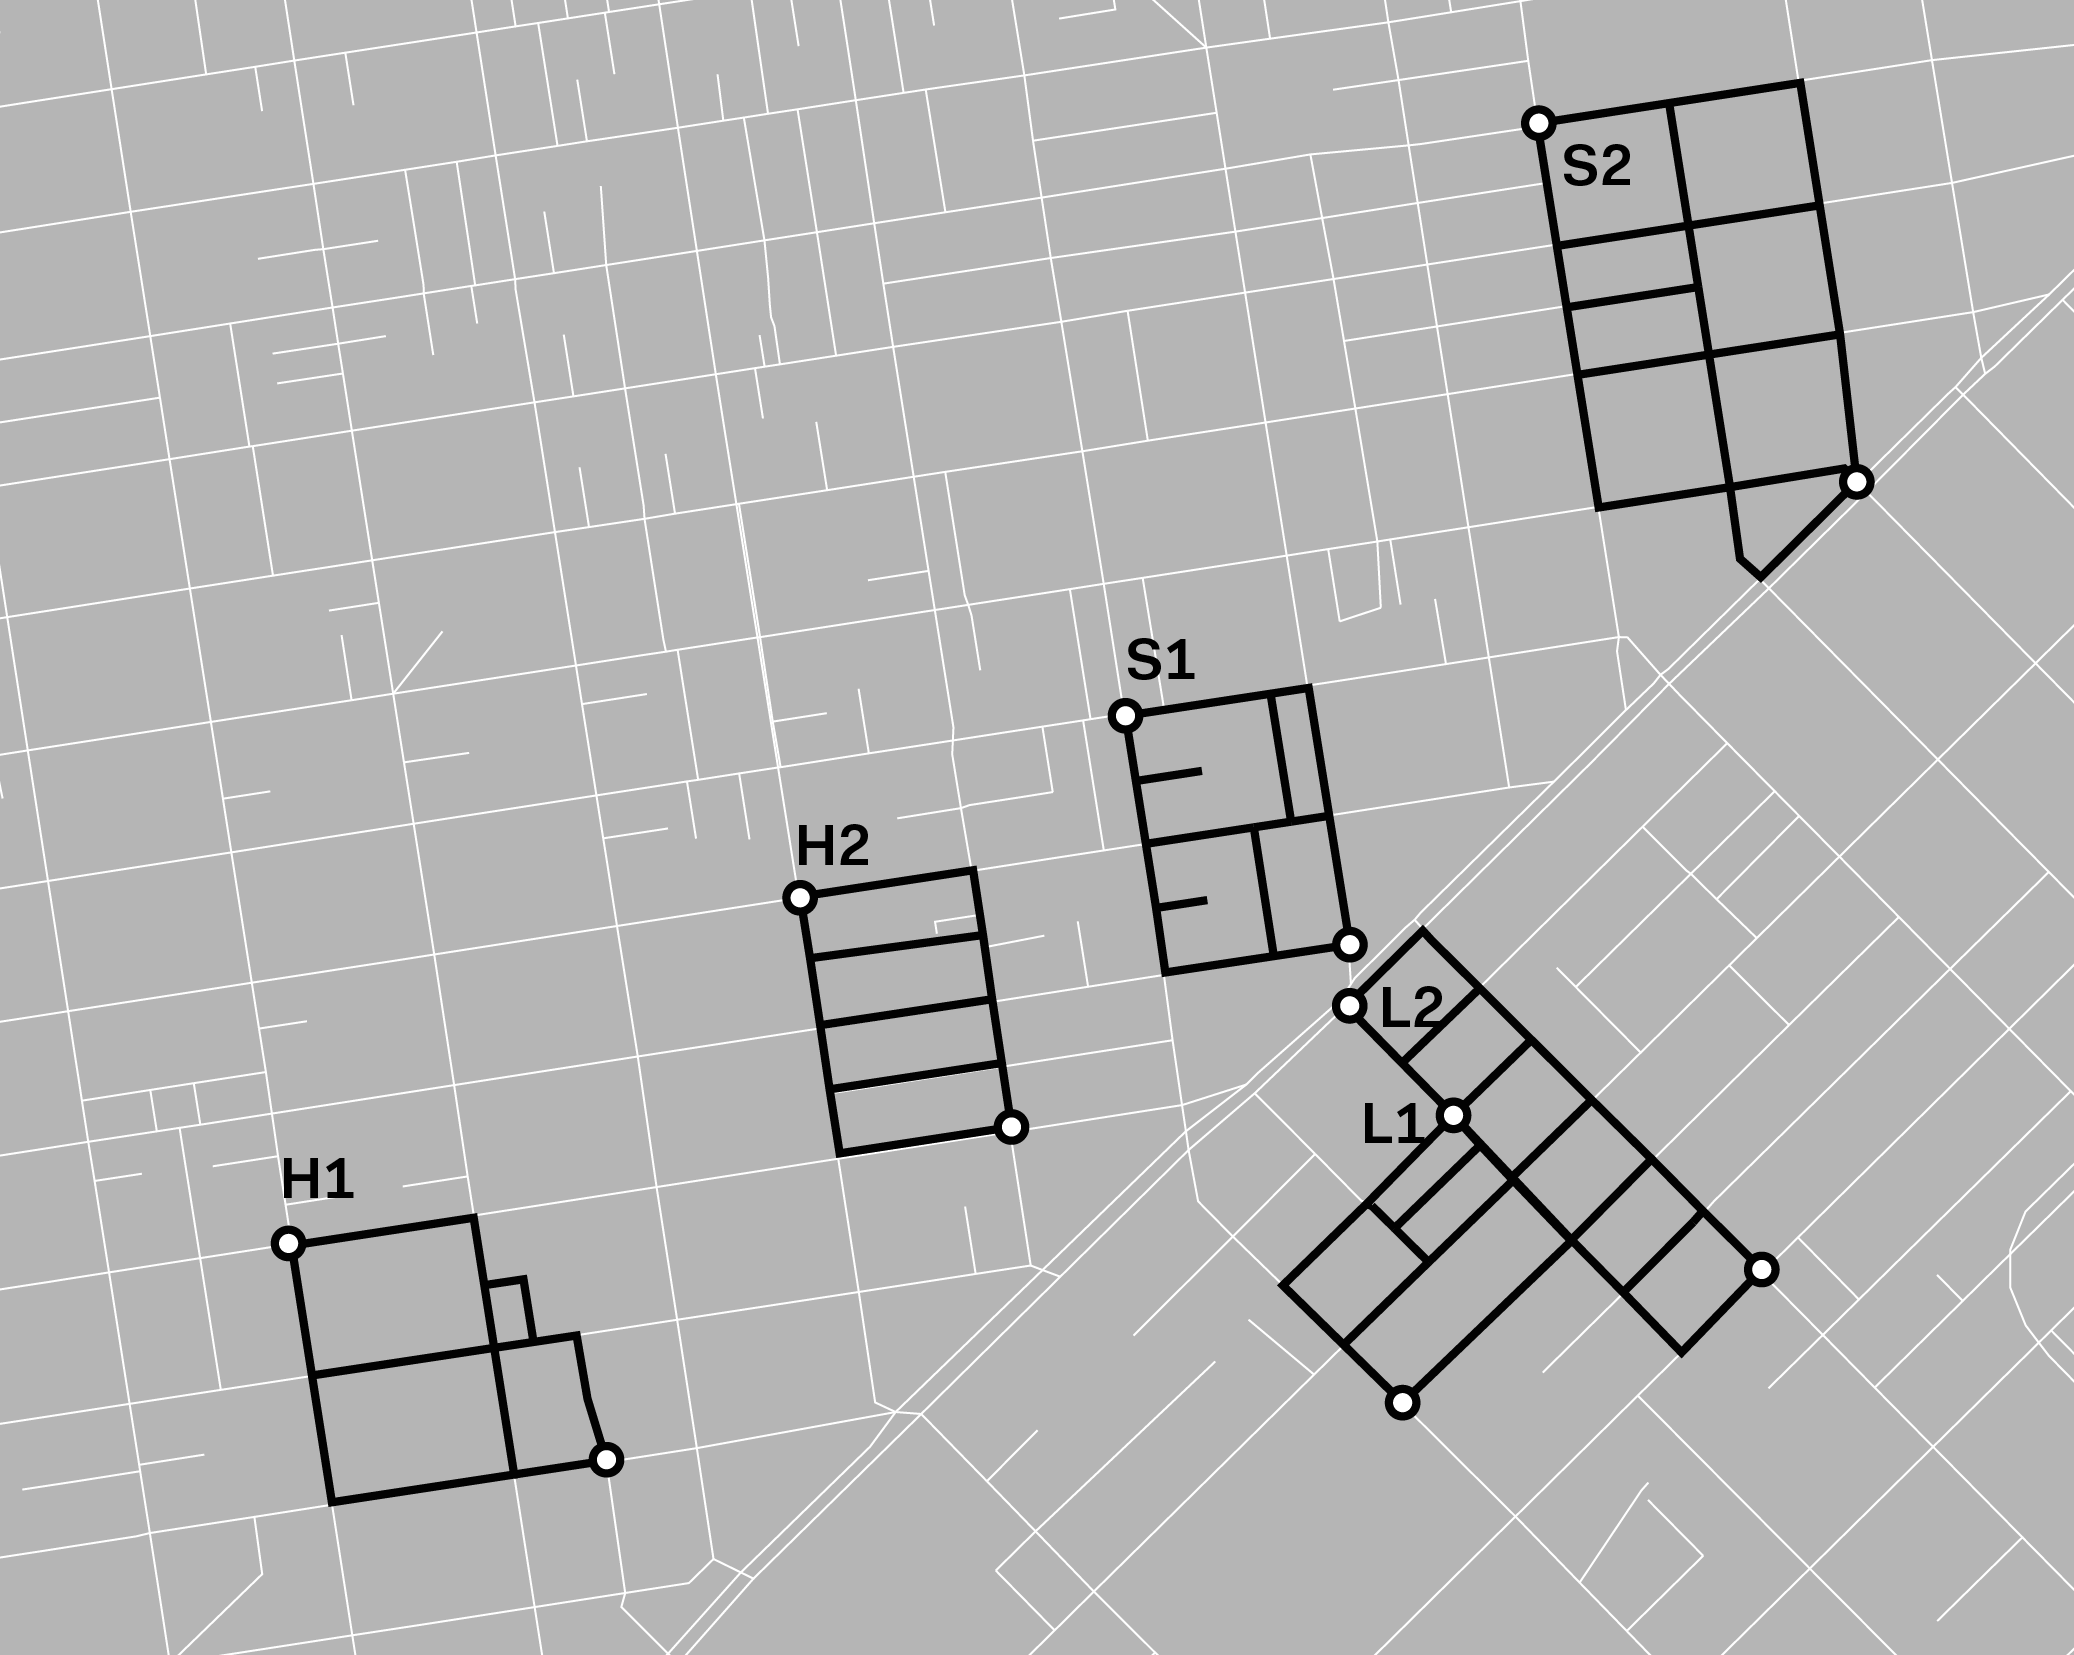
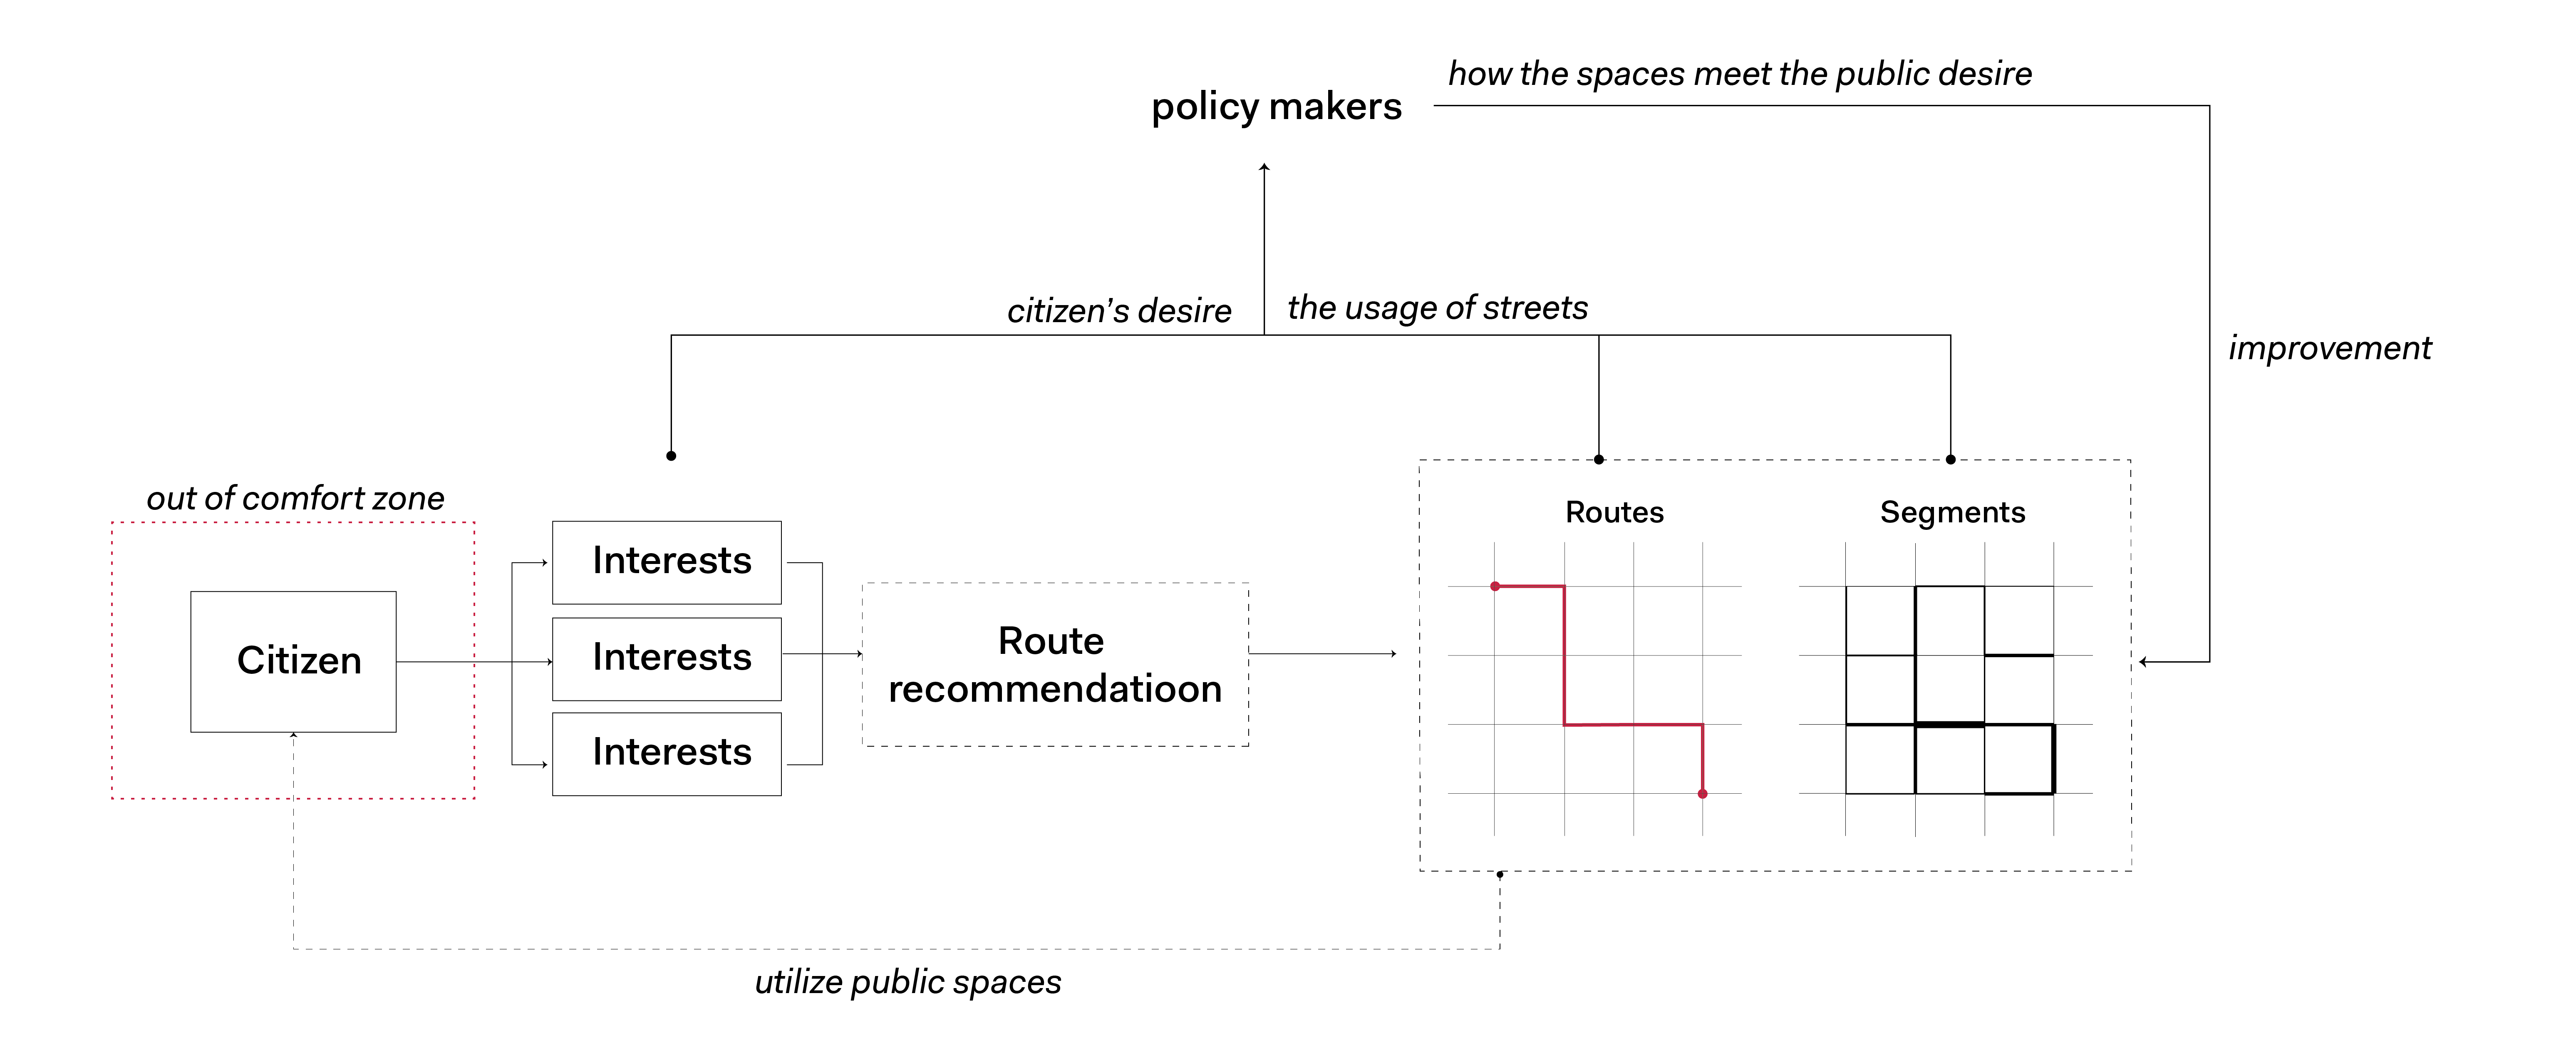
Moreover, this methodology allows pedestrians to choose an optimized route based on individual criteria: users designate the preferences, and their associated attributes are applied as weights for computing the ‘perceived distance’ to get the best route.
The data accumulated by users could be analyzed and provided to decision-makers for a feedback loop. For instance, the interests the users select can represent the citizen’s expectations from the public space, and thechosen routes reflect how well the physical attributes are related to these expectations and which street segments are serving them well. Ideally, this data can be compared with design and planning intention, and it would generate a constructive feedback loop. Thus, it will establish a responsive environment which adapts to how the city spaces are perceived as well as the enjoyment experienced by citizens.
![]()
︎︎︎ Next Step (Product Design)
︎︎︎ Go Back
Scalability and Feedback loop
︎︎︎ Next Step (Product Design)
︎︎︎ Go Back
#Data-driven #DataVisualization #Mapping #NLP #Emotion
Urban Emotion
; The interrogation of social media and its implications within an urban context
Harvard Graduate School of Design | 2019
Instructor: Jose Luis Garcia del Castillo Lopez
Team: David Rosenwasser
Role: Ideation, research, data collection, NLP, data visualization
Tools: Mapbox API(JavaScript), Python, Watson Tone Analyzer
Data: Instagram posts with geo-location data
Conference Paper published (eCAADe 2020)
![]()
>> Social media as an analytical tool,
helping to transform public policy-making
![]()
Feedback Loop for decision-makers and the public space users
10,000 instagram Boston-geographically-related posts were collected.
![]()
![]()
![]()
Sample data of GeoJSON as a result of emotion analysis
![]()
 L: Highlighting activity by date and visualizing these changes over time.
R: Showcasing a changing visualization of activity during differing blocks of hours during the day.
![]()
![]()
![]() User demonstrations and activity from exhibition
User demonstrations and activity from exhibition
︎︎︎ Go Back
Urban Emotion
; The interrogation of social media and its implications within an urban contextHarvard Graduate School of Design | 2019
Instructor: Jose Luis Garcia del Castillo Lopez
Team: David Rosenwasser
Role: Ideation, research, data collection, NLP, data visualization
Tools: Mapbox API(JavaScript), Python, Watson Tone Analyzer
Data: Instagram posts with geo-location data
Conference Paper published (eCAADe 2020)
> How might we analyze how citizens perceive the public spaces?
| Problem |
Designers and planners find it challenging to constantly connect with their users and receive feedback from the spaces they created.
| Goal |
1) Help decision-makers and designers easily understand how public spaces are utilized and perceived by users.
2) Create a feedback loop that decision-makers find whether the places are utilized as they intended.
>> Social media as an analytical tool,
helping to transform public policy-making
by detecting emotions using Natural Language Processing
How it works
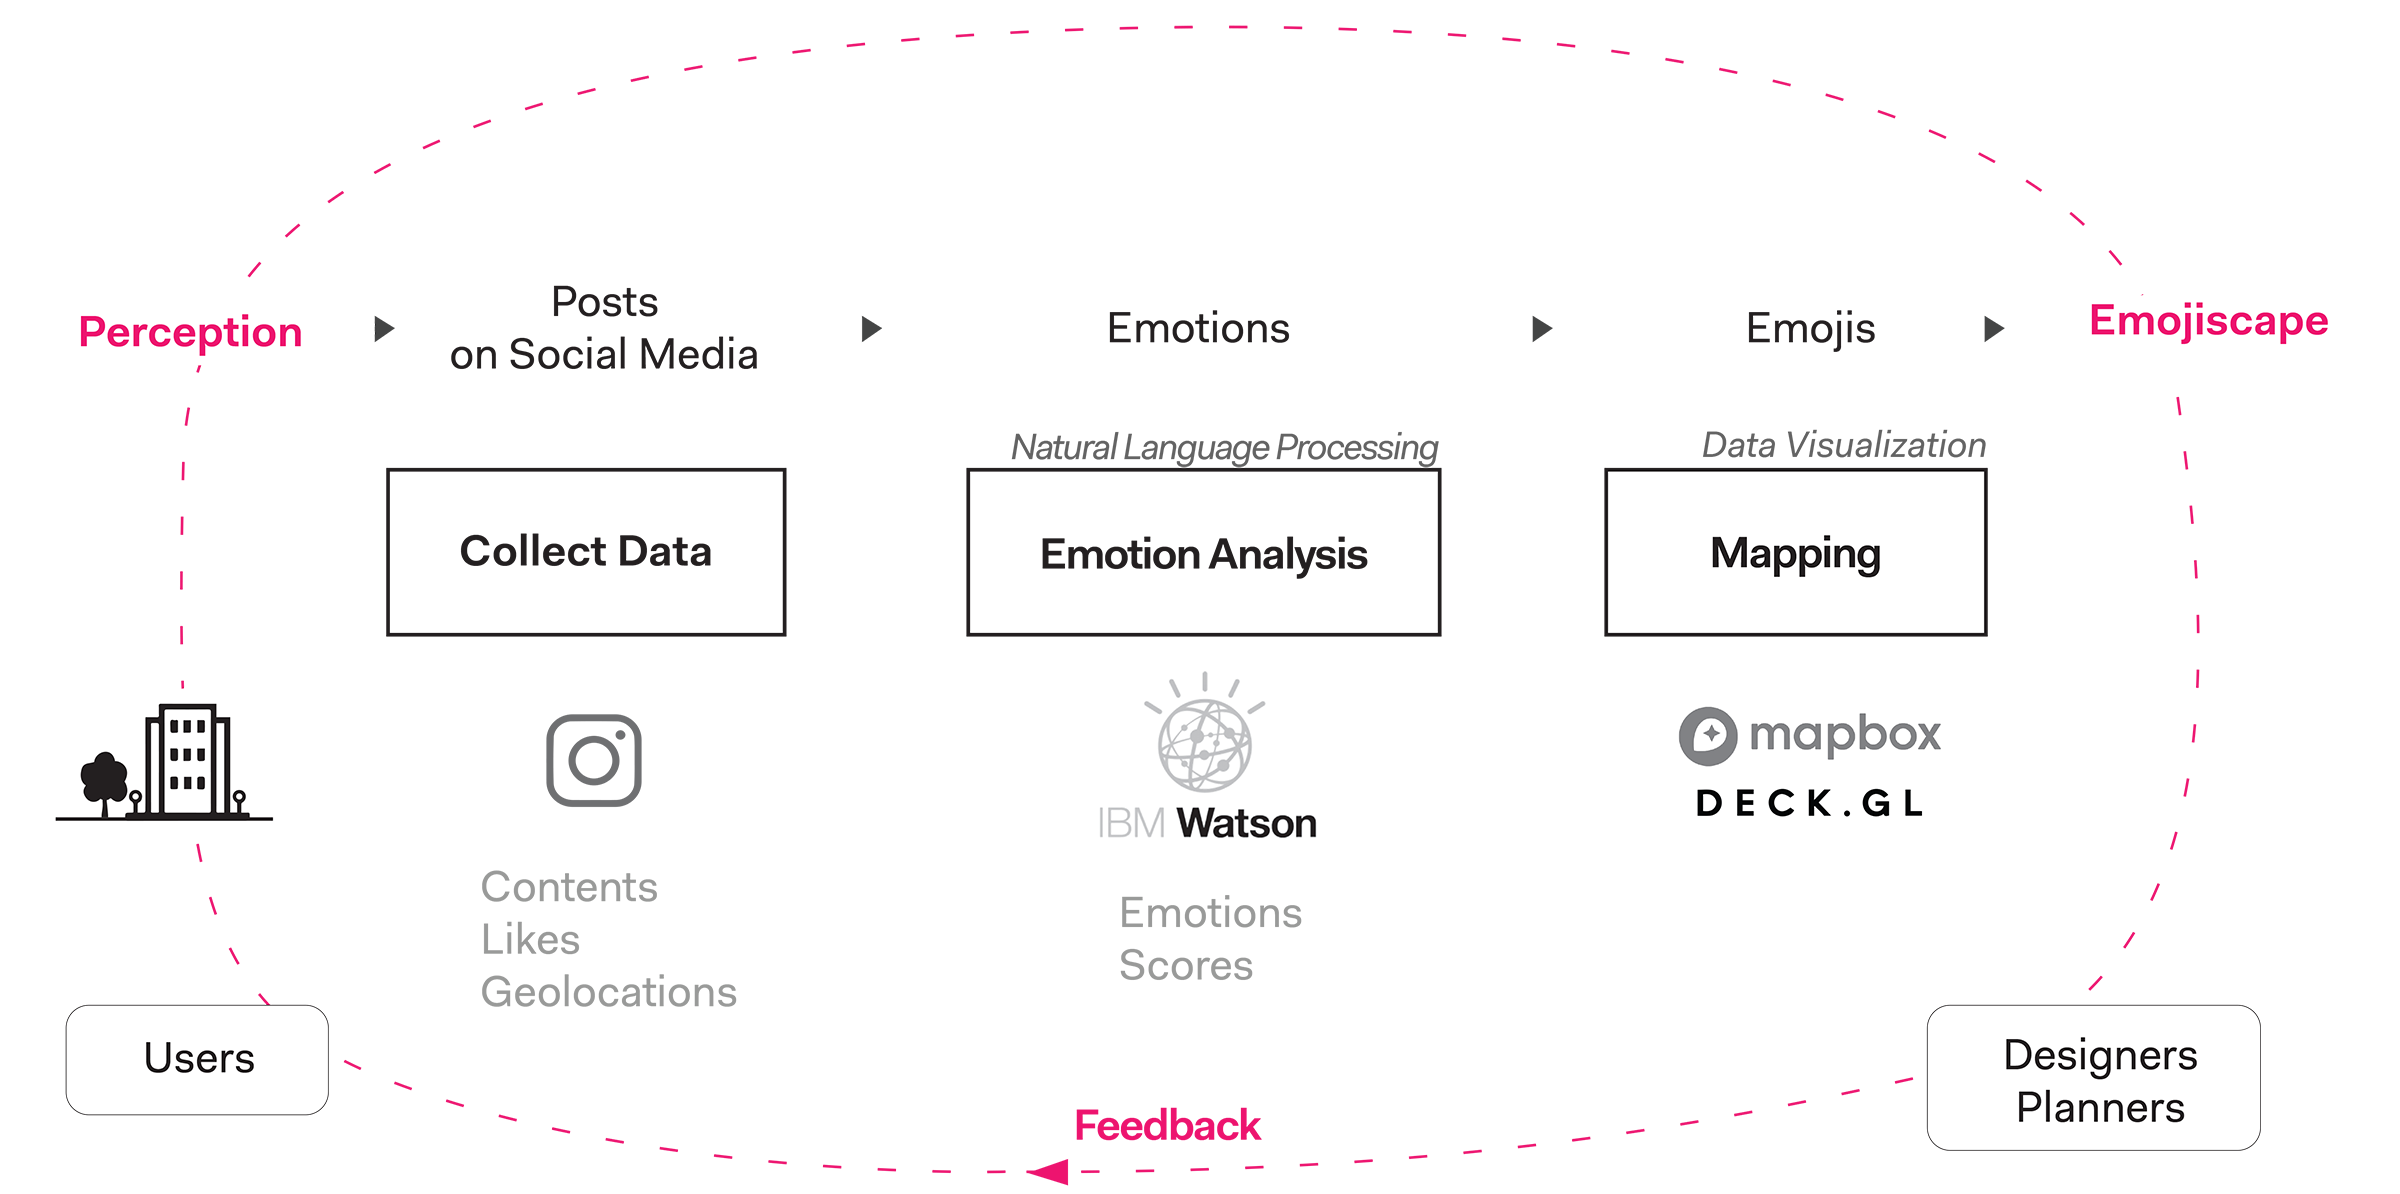
Feedback Loop for decision-makers and the public space users
| Data Collection |
10,000 instagram Boston-geographically-related posts were collected.
- Posts contained a geotagged location.
- Data was derived from the 1000 most posted about locations in order to limit the scope to places that had larger numbers of posts for the analysis.
- The search filtered out posts with the locations “Boston, Massachusetts,” “Cambridge,” “South Boston,” and “East Boston” due to the broad nature of these locations.
- All posts were geotagged within a 2 mile radius of coordinate 42.361139, -71.058254, the centermost part of Boston, where Boston City Hall is located.
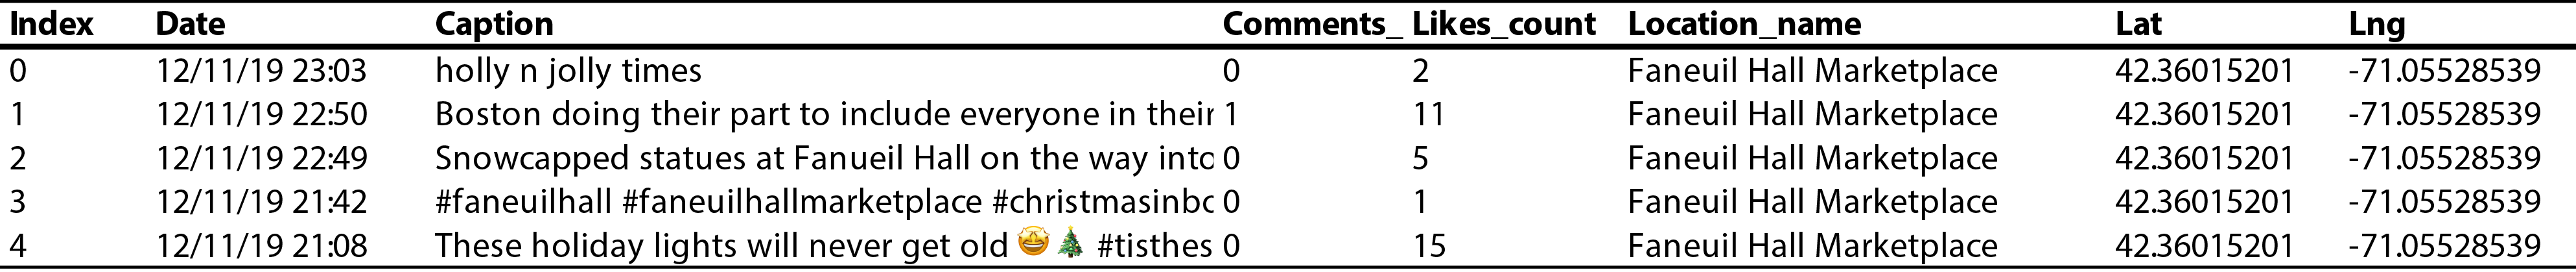
Example of data found within CSV file. Each instagram post is broken down by row
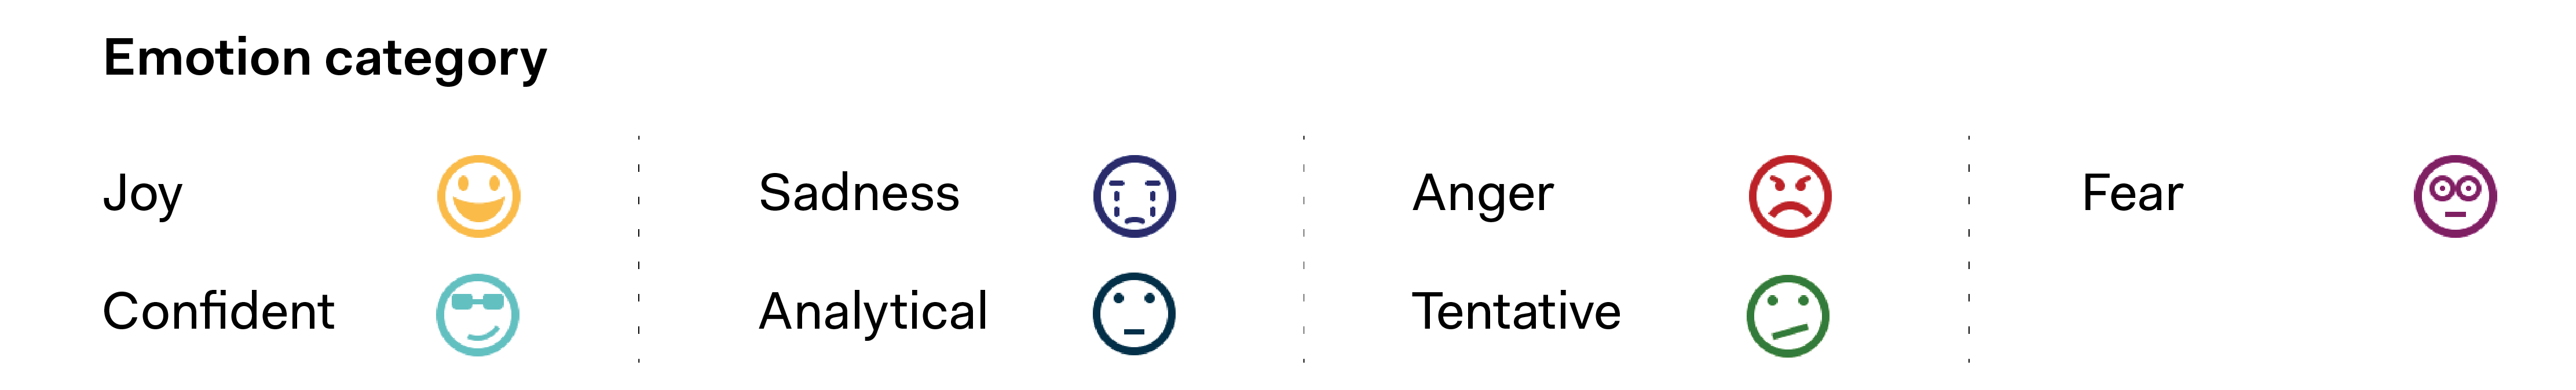
| Natural Language Processing |
The emotion and score of each post was extracted from its content, using IBM Watson Tone Analyzer API.
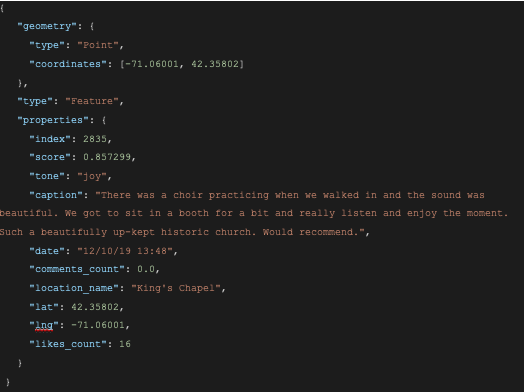
Sample data of GeoJSON as a result of emotion analysis
Prototype
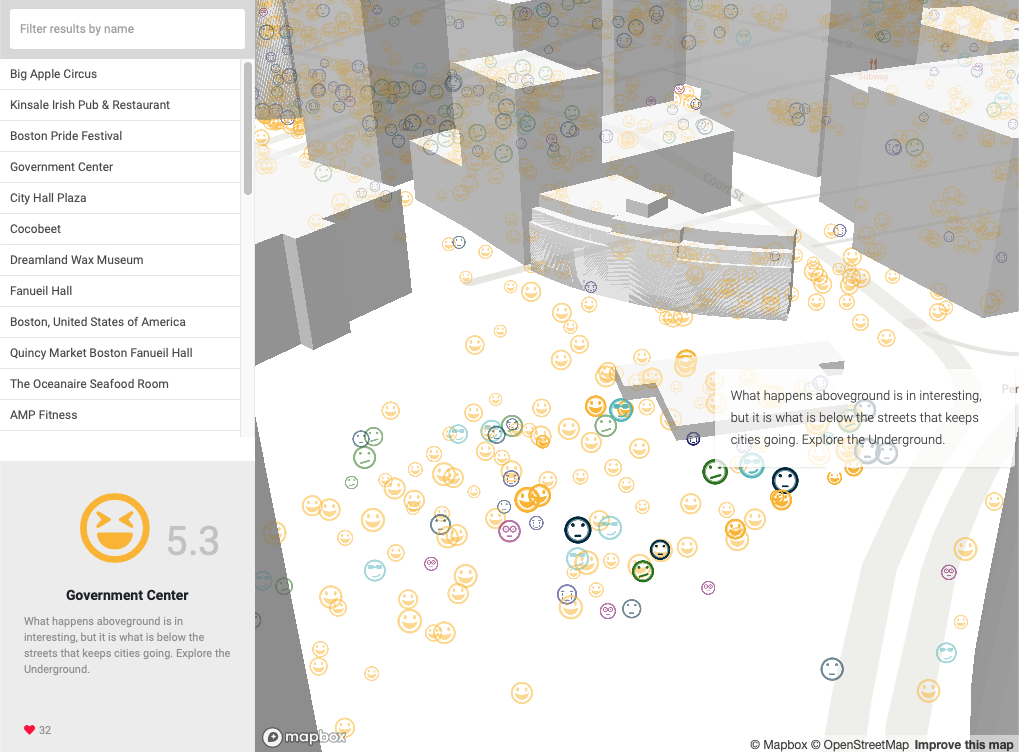
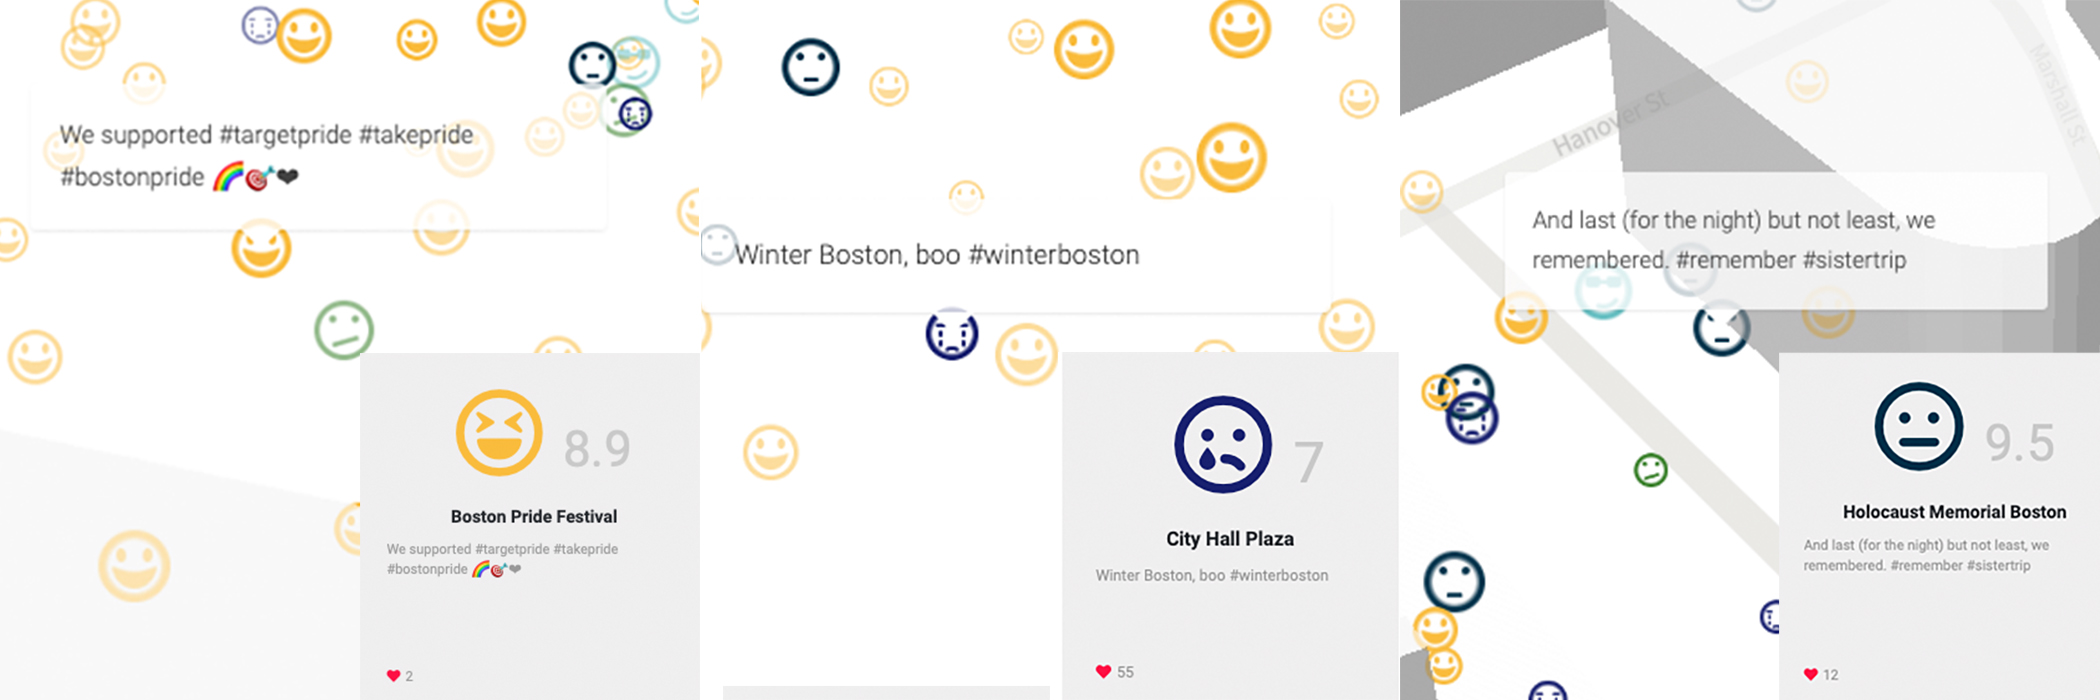
| EmojiScape |
Qualitative representation of the inhabitants’ perception of the urban fabric
![]()
| TrendScape |
Temporal dimension of emotions and the understanding of their evolving quality
| TrendScape |
Temporal dimension of emotions and the understanding of their evolving quality
 L: Highlighting activity by date and visualizing these changes over time.
R: Showcasing a changing visualization of activity during differing blocks of hours during the day.
Exhibition

 User demonstrations and activity from exhibition
︎︎︎ Go Back
#Data-driven #DataVisualization #Mapping #UrbanSegregation
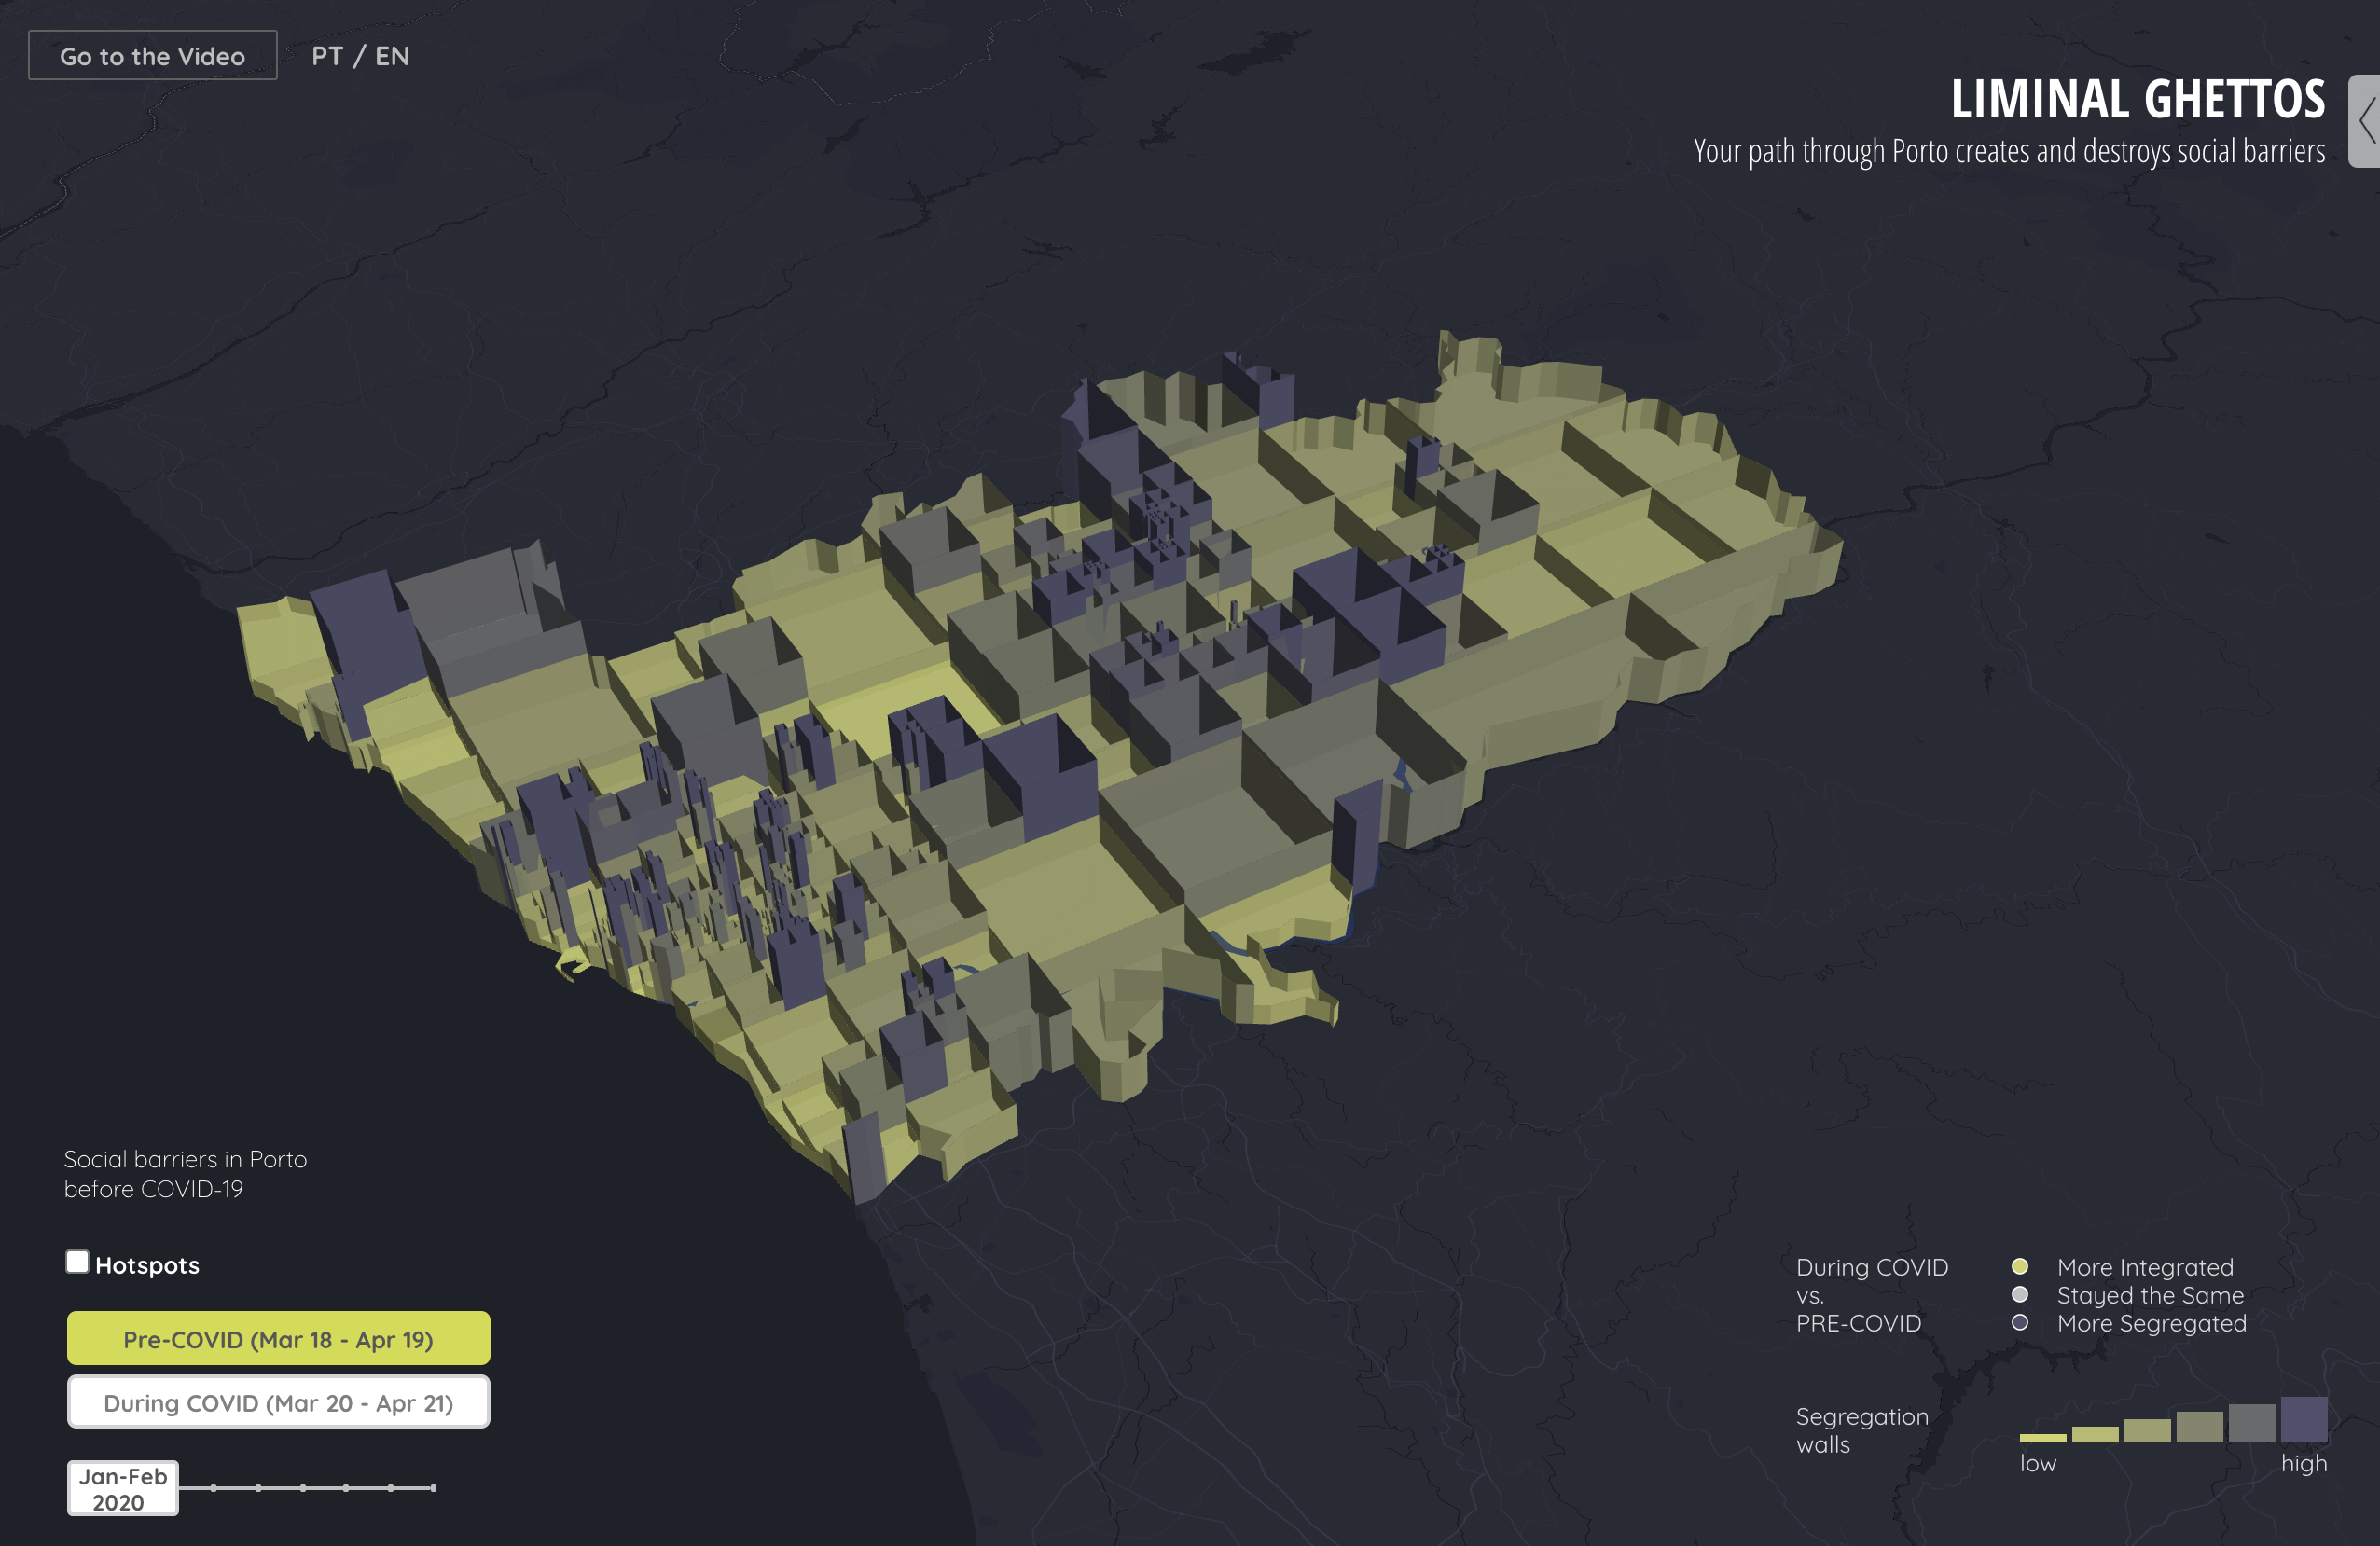
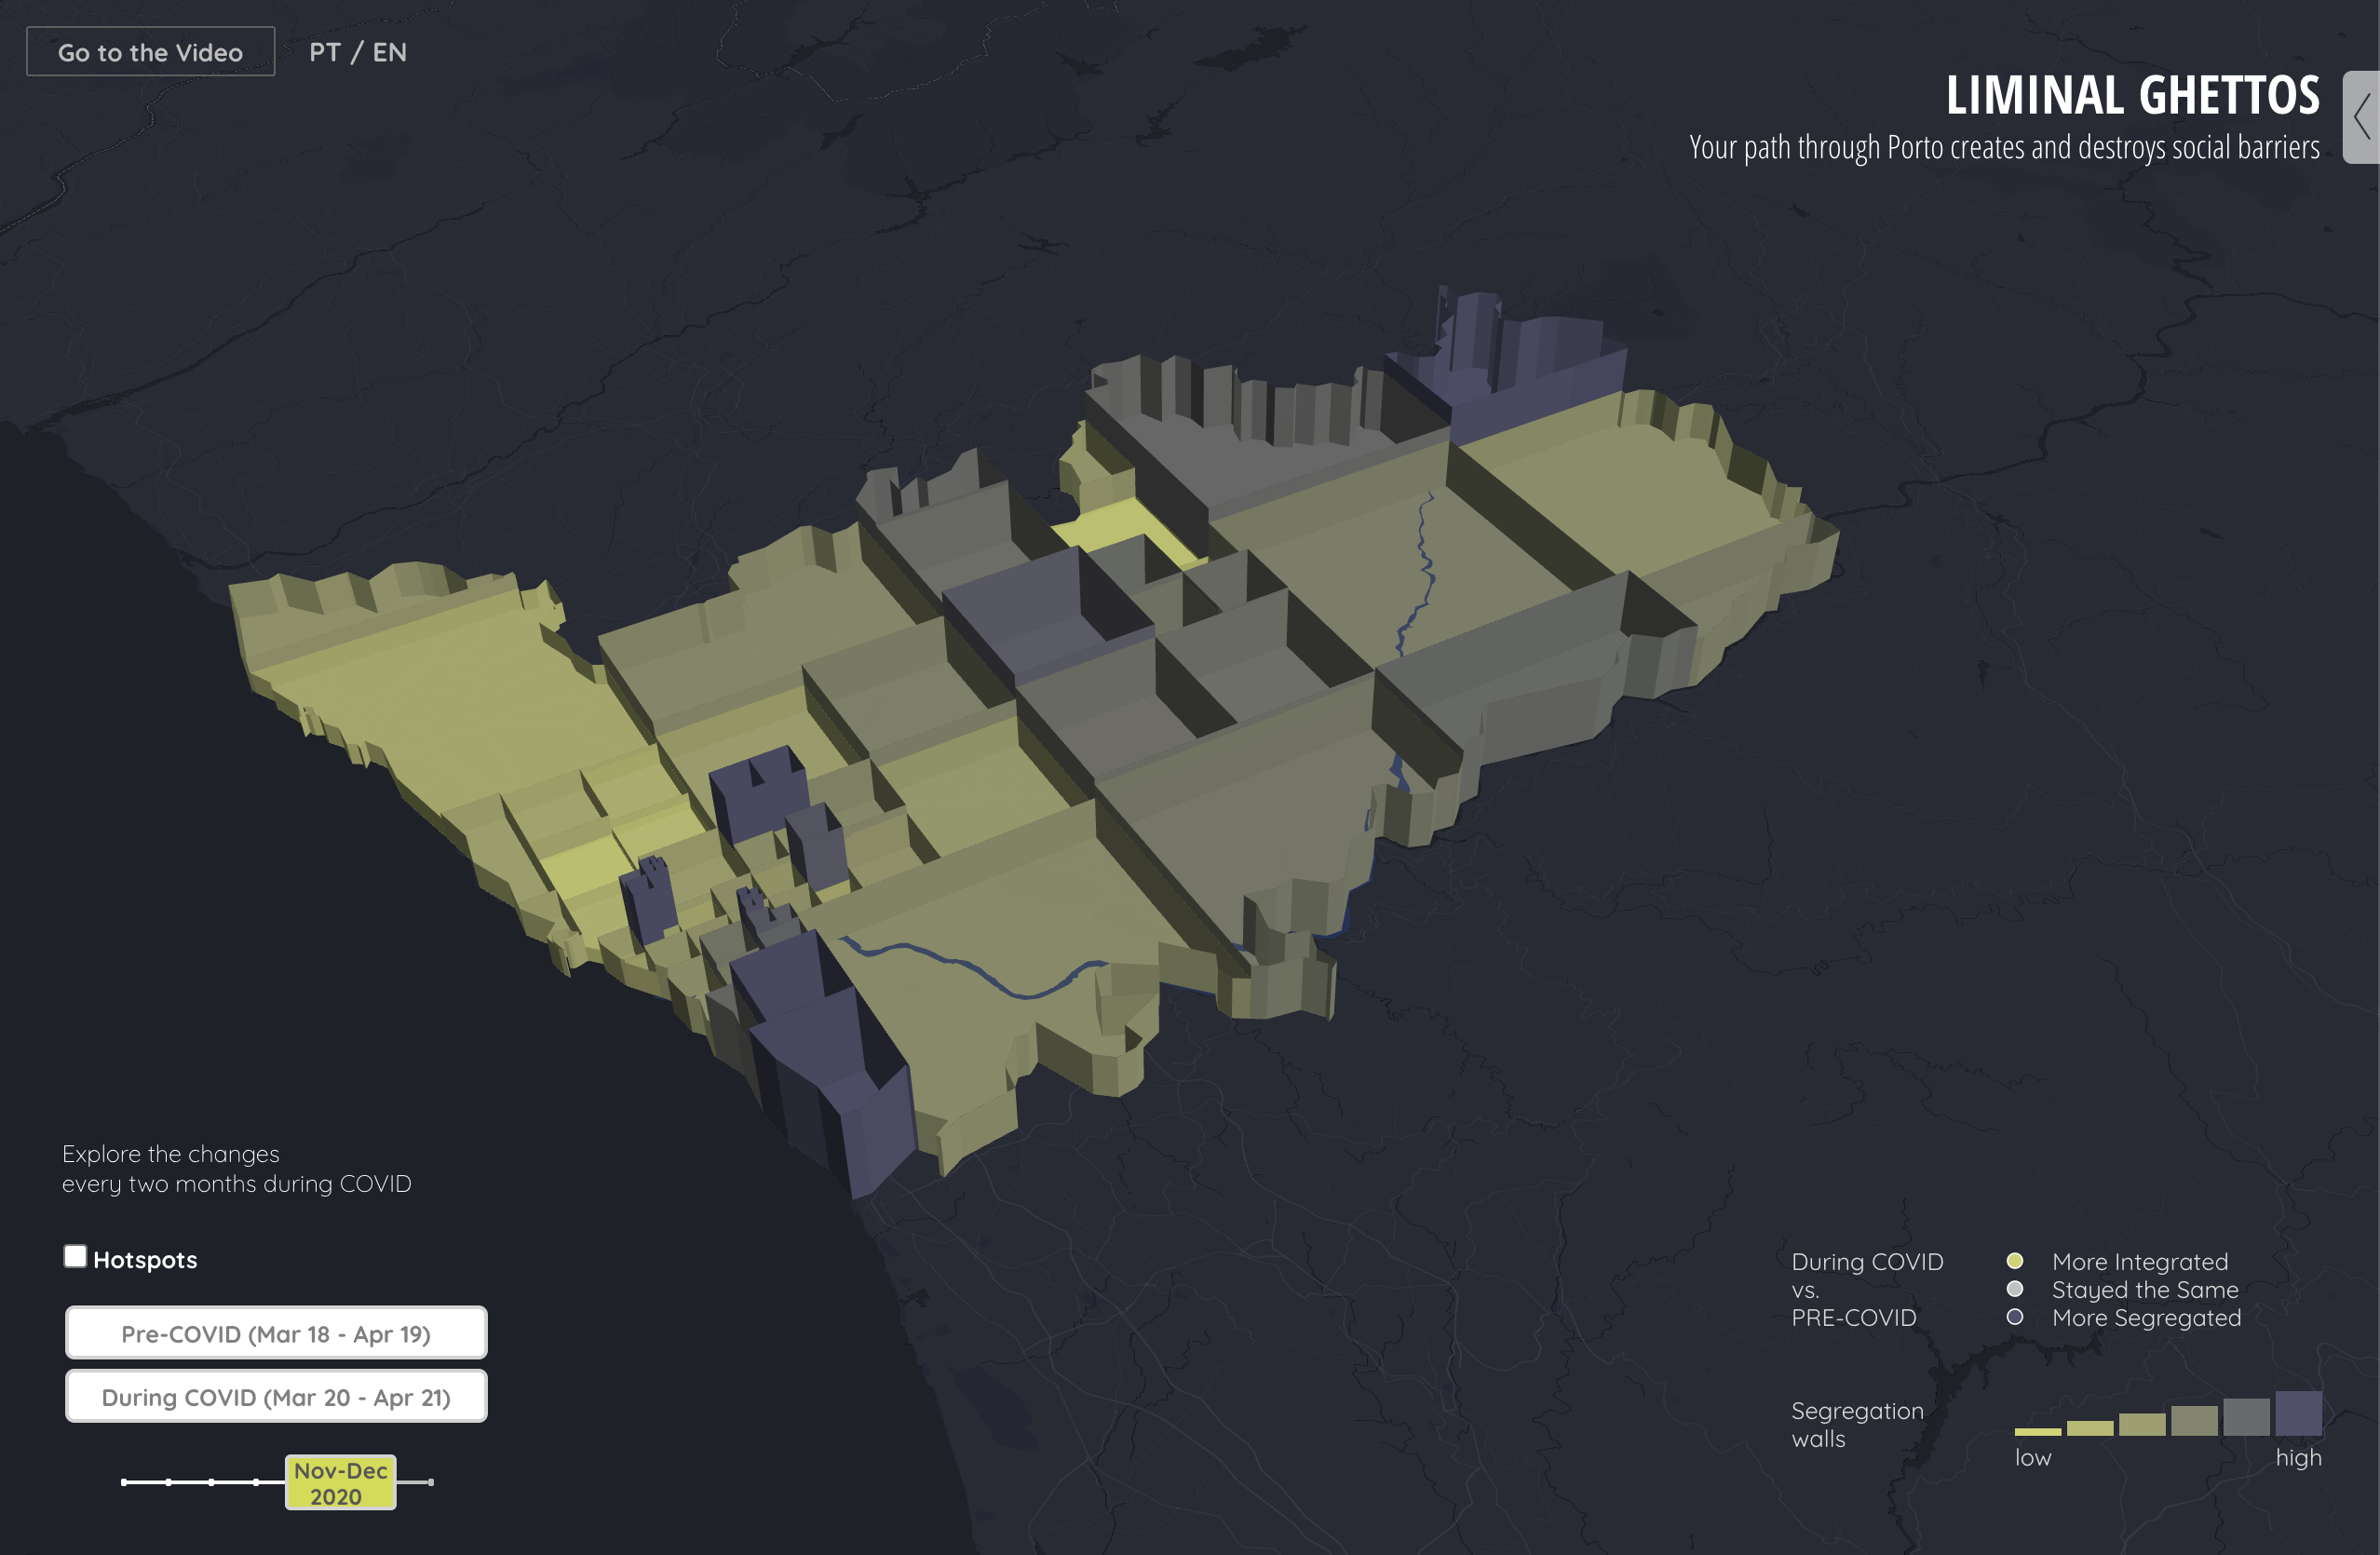
Liminal Ghettos | Porto Design Biennale 2021
; Revealing urban segregation by analyzing social media
MIT Senseable City Lab | 2021
Role: Research, Data visualization, Video
Tools: Deck.gl, React, Adobe After Effects
Data: Twitter data
︎︎︎ Data Visualization
![]()
![]()
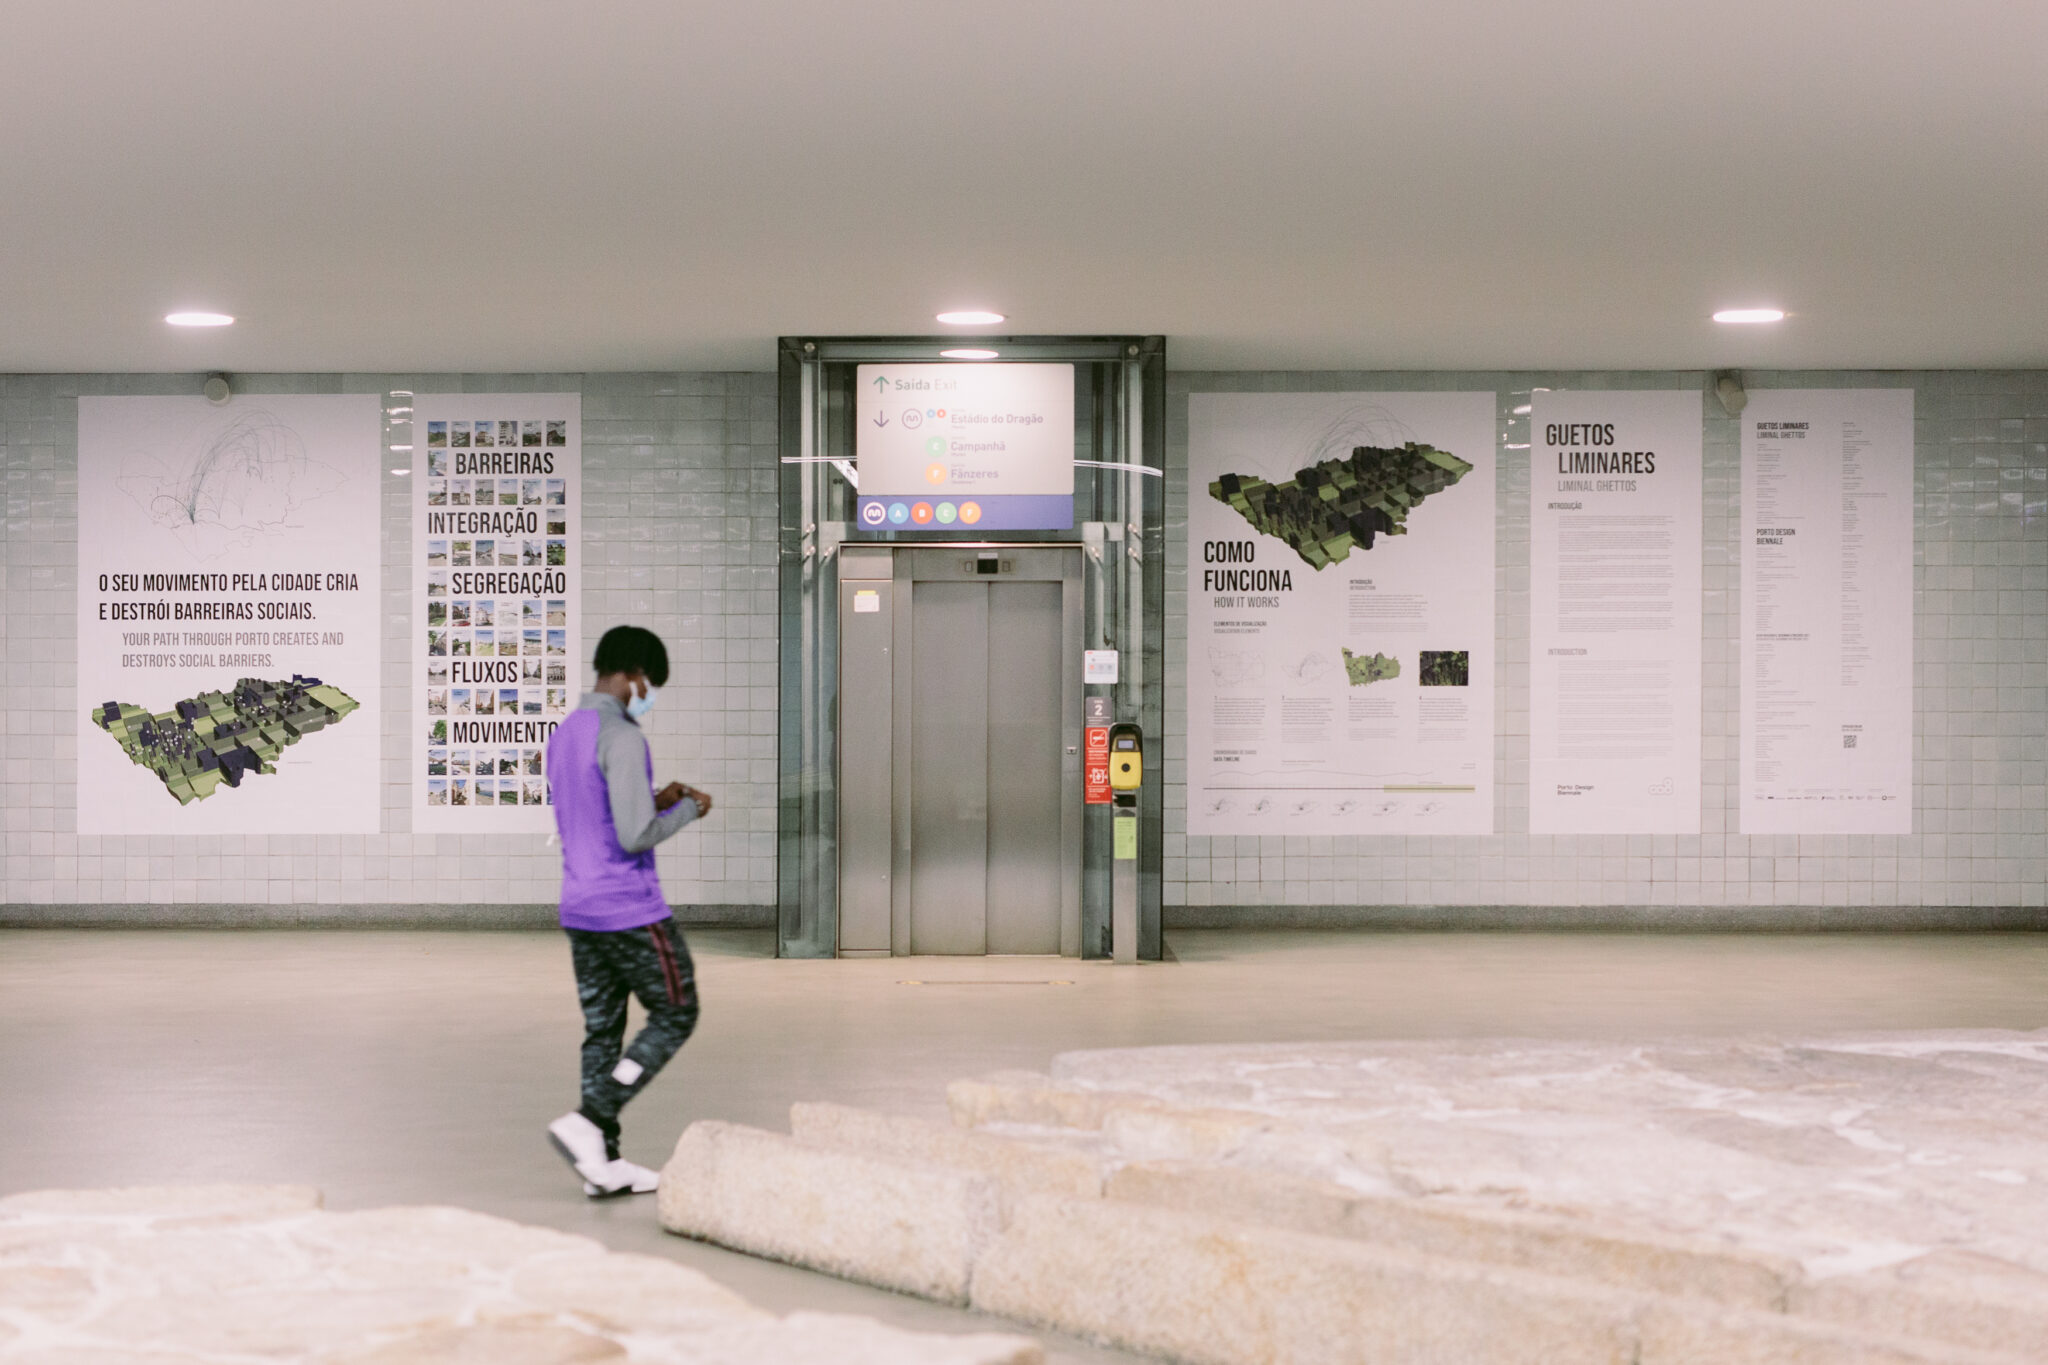
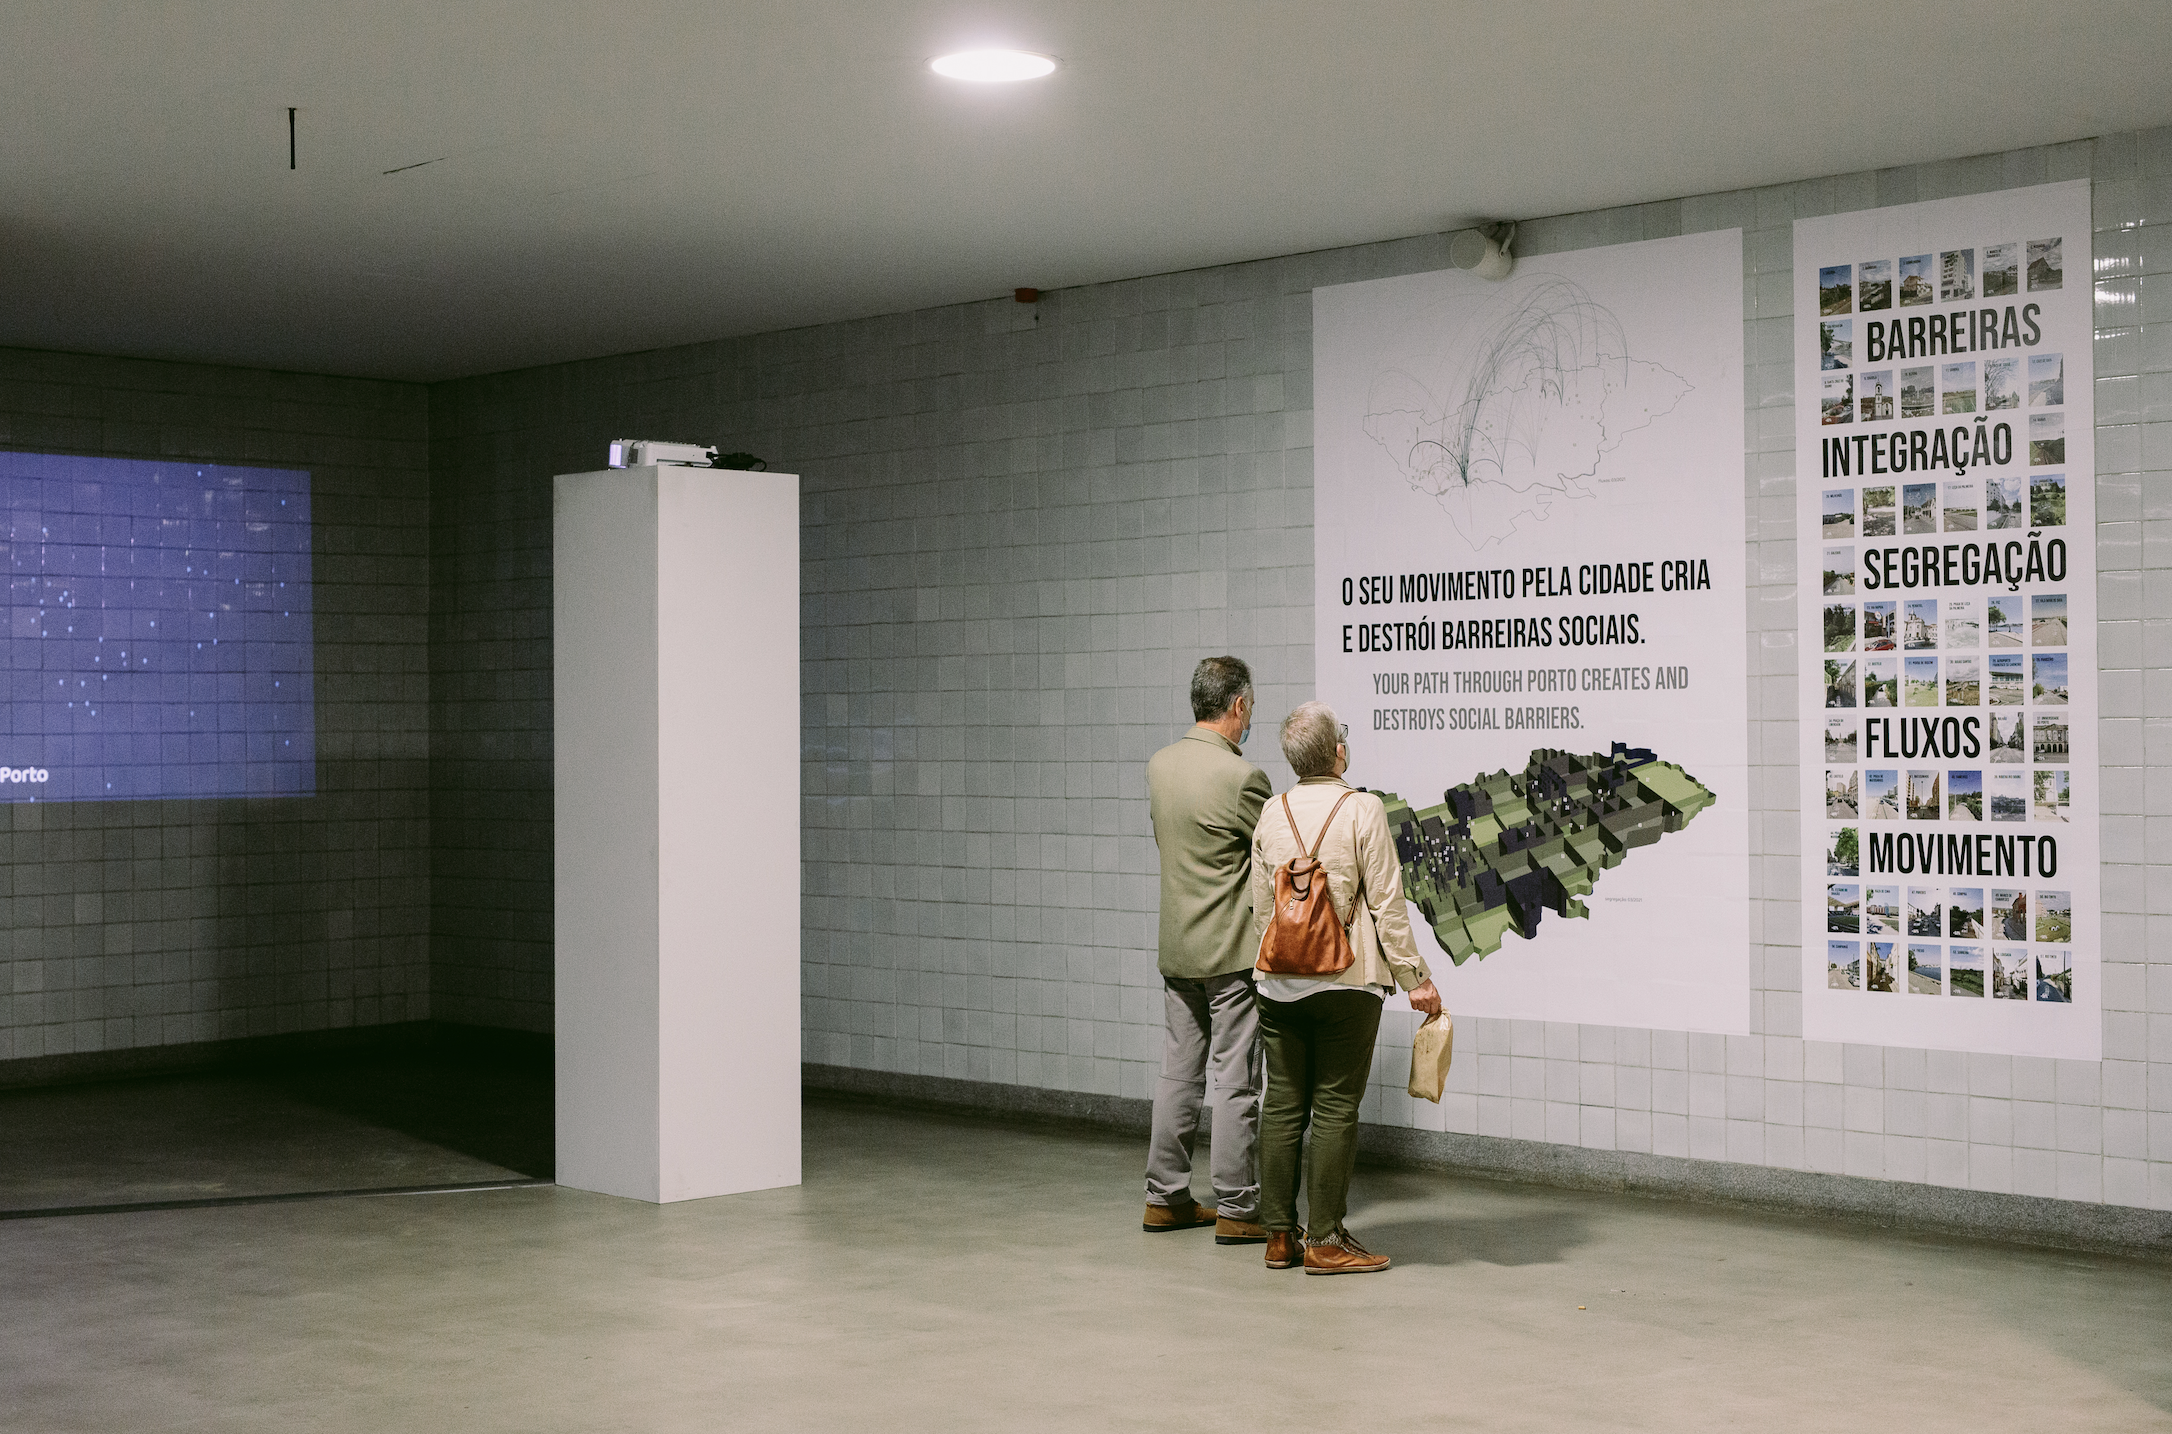
︎︎︎ Porto Design Biennale Exhibition 2021
![]()
![]()
︎︎︎ Go Back
Liminal Ghettos | Porto Design Biennale 2021
; Revealing urban segregation by analyzing social mediaMIT Senseable City Lab | 2021
Role: Research, Data visualization, Video
Tools: Deck.gl, React, Adobe After Effects
Data: Twitter data
Porto Design Biennale Exhibition 2021
Senseable City Lab | MIT
https://portodesignbiennale.pt/en/events/liminal-ghettos
https://www.senseable.mit.edu/porto/
Senseable City Lab | MIT
https://portodesignbiennale.pt/en/events/liminal-ghettos
https://www.senseable.mit.edu/porto/
> Your path through Porto creates and destroyes social barriers
︎︎︎ Data Visualization
︎︎︎ Porto Design Biennale Exhibition 2021
︎︎︎ Go Back
#DataVisualization
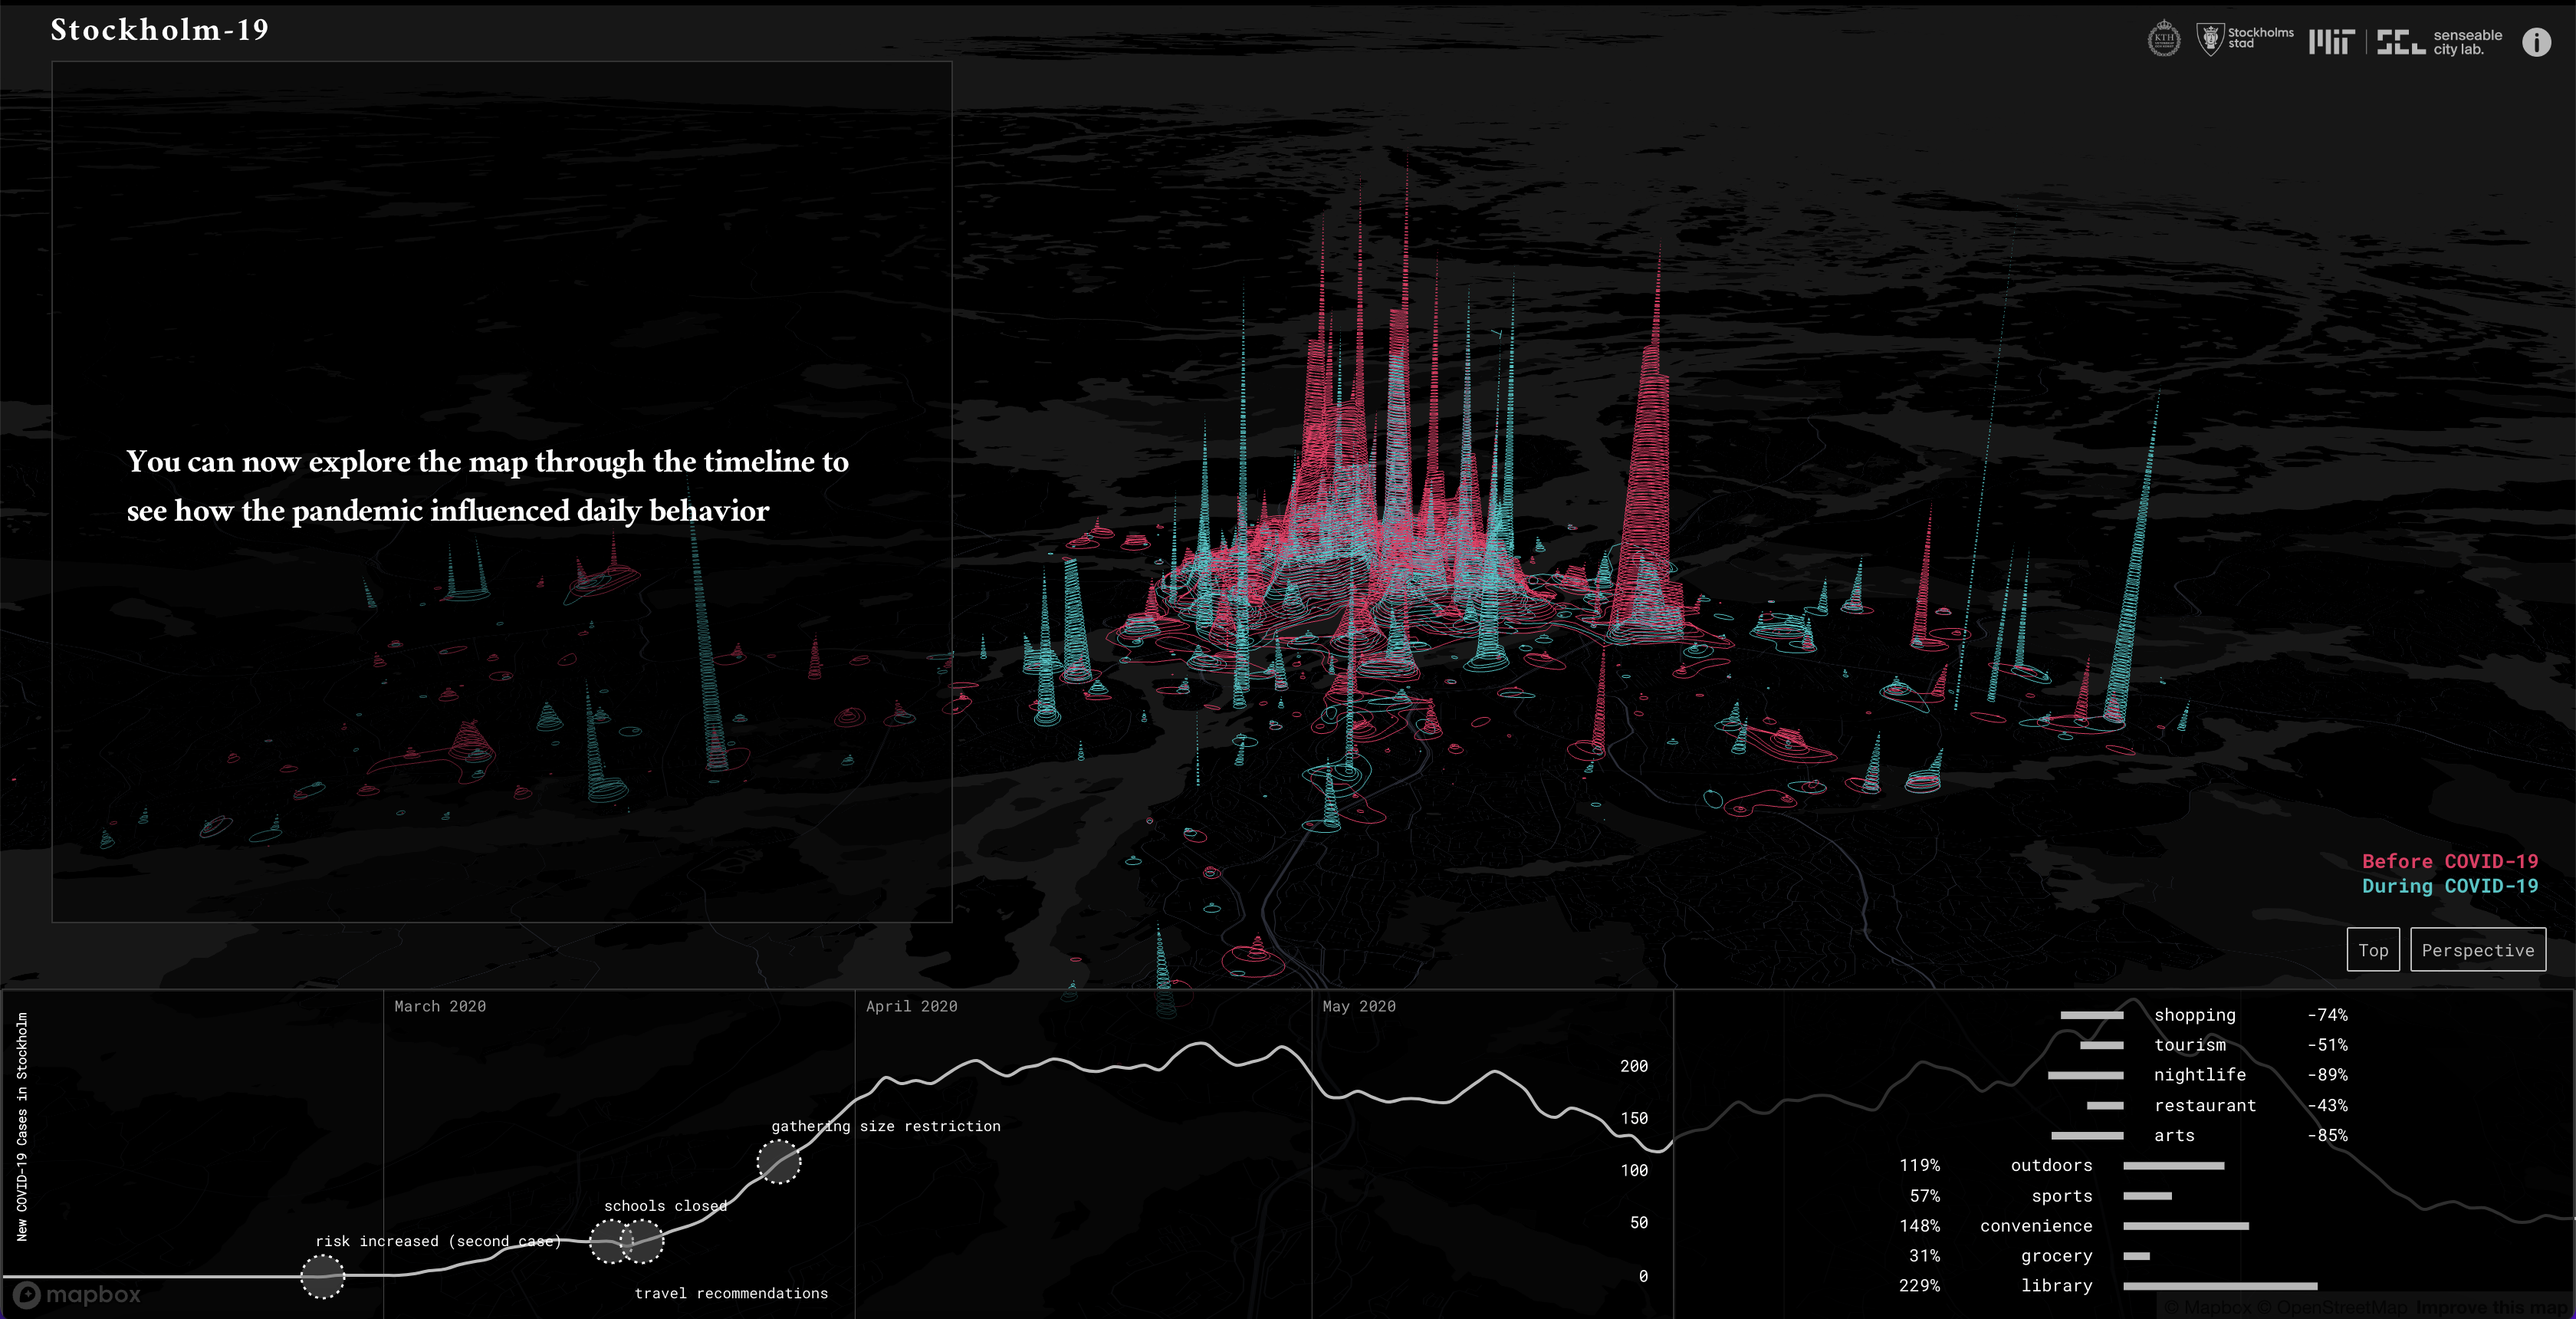
Stockholm-19
; Revealing urban segregation by analyzing social media
MIT Senseable City Lab | 2022
Role: Data visualization
Tools: Deck.gl, React
> How has access to
![]()
![]()
︎︎︎ Data Visualization
︎︎︎ Go Back
Stockholm-19
; Revealing urban segregation by analyzing social mediaMIT Senseable City Lab | 2022
Role: Data visualization
Tools: Deck.gl, React
> How has access to
parks / restaurants / groceries / schools
changed during COVID-19?

︎︎︎ Data Visualization
︎︎︎ Go Back
#DataVisualization
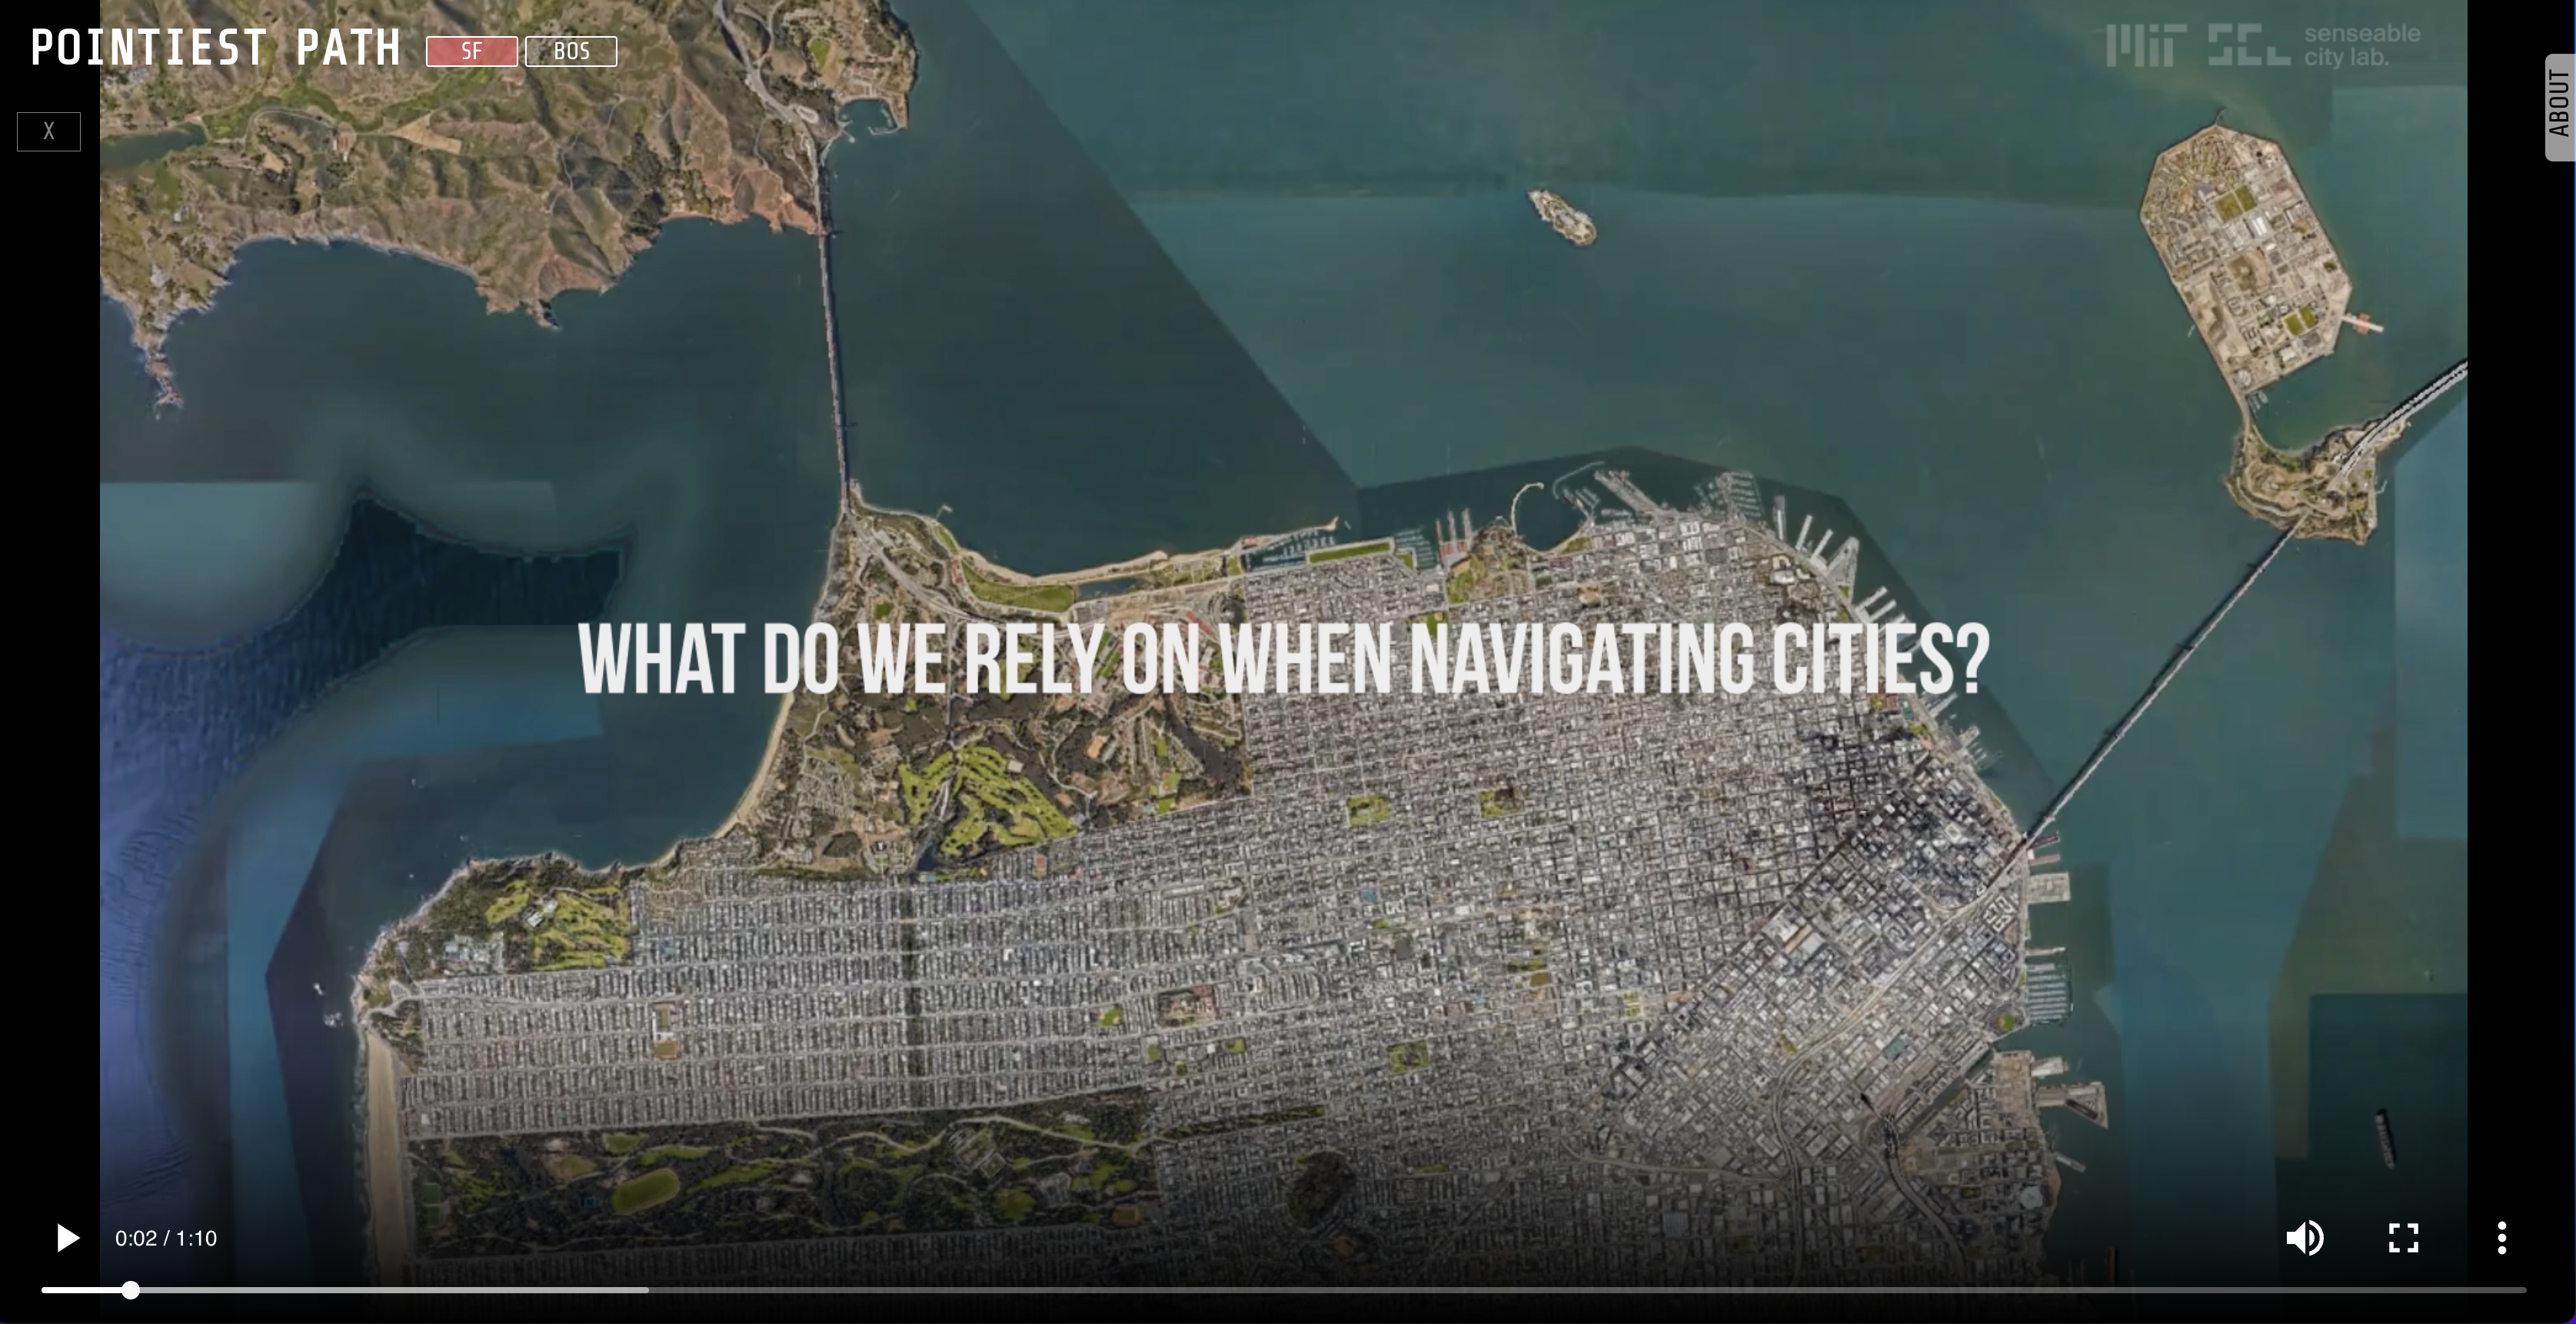
Pointiest Path
; Revealing pedestrian behavior patterns
MIT Senseable City Lab | 2021
Role: Data visualization, Video
Tools: Deck.gl, React, Adobe AfterEffect
> How do people decide which way to go
![]()
![]()
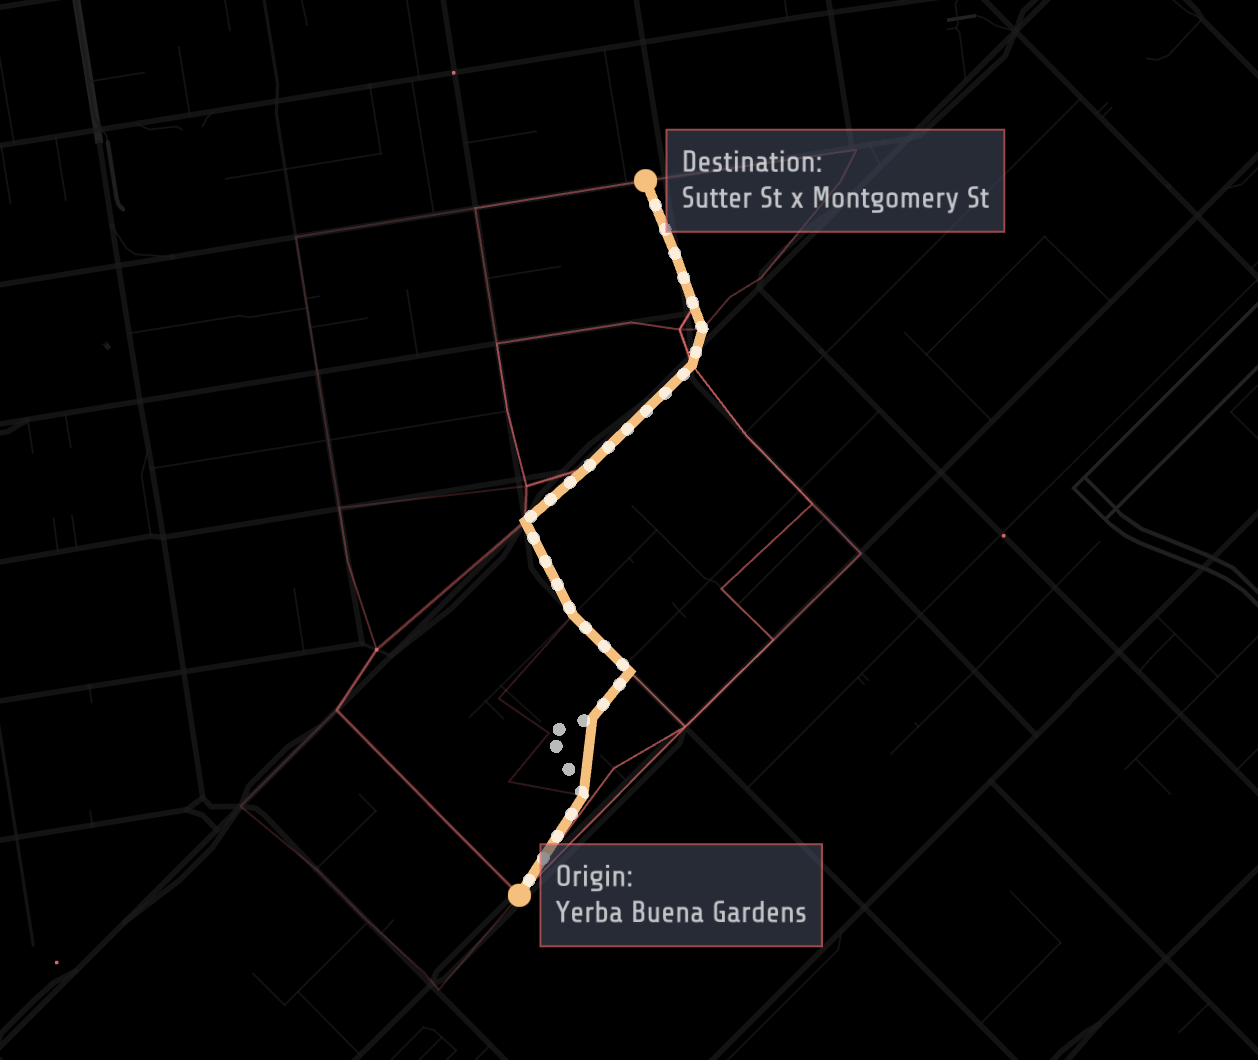
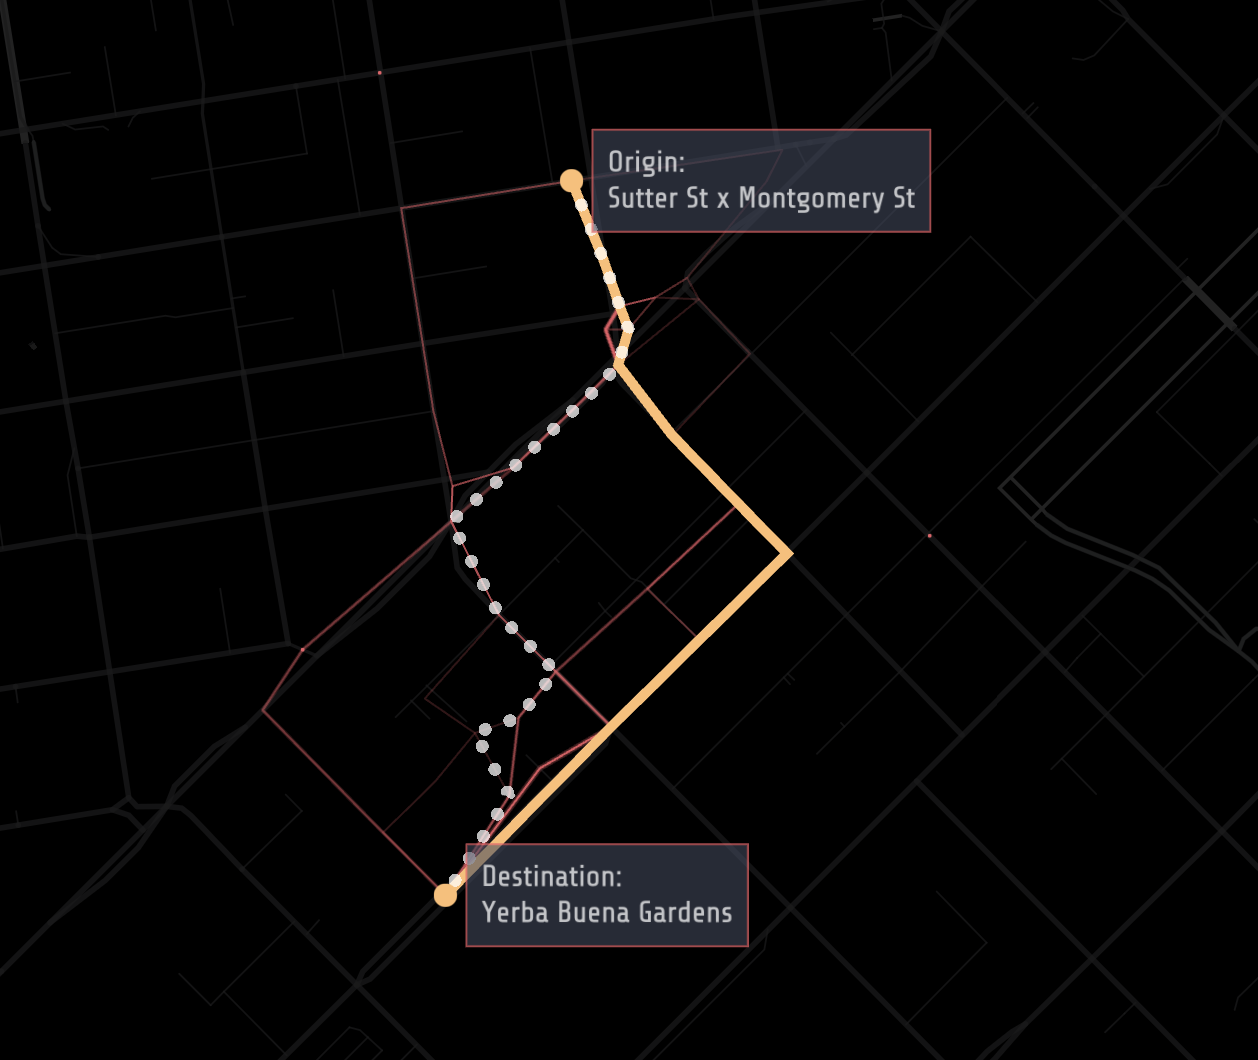
The analysis showed that instead of choosing shortest routes, pedestrians chose routes that were slightly longer but more directly point towards the destination — the pointiest paths.
![]() .
. ![]()
︎︎︎ Data Visualization
︎︎︎ Go Back
Pointiest Path
; Revealing pedestrian behavior patterns MIT Senseable City Lab | 2021
Role: Data visualization, Video
Tools: Deck.gl, React, Adobe AfterEffect
> How do people decide which way to go
when they walk around the city?
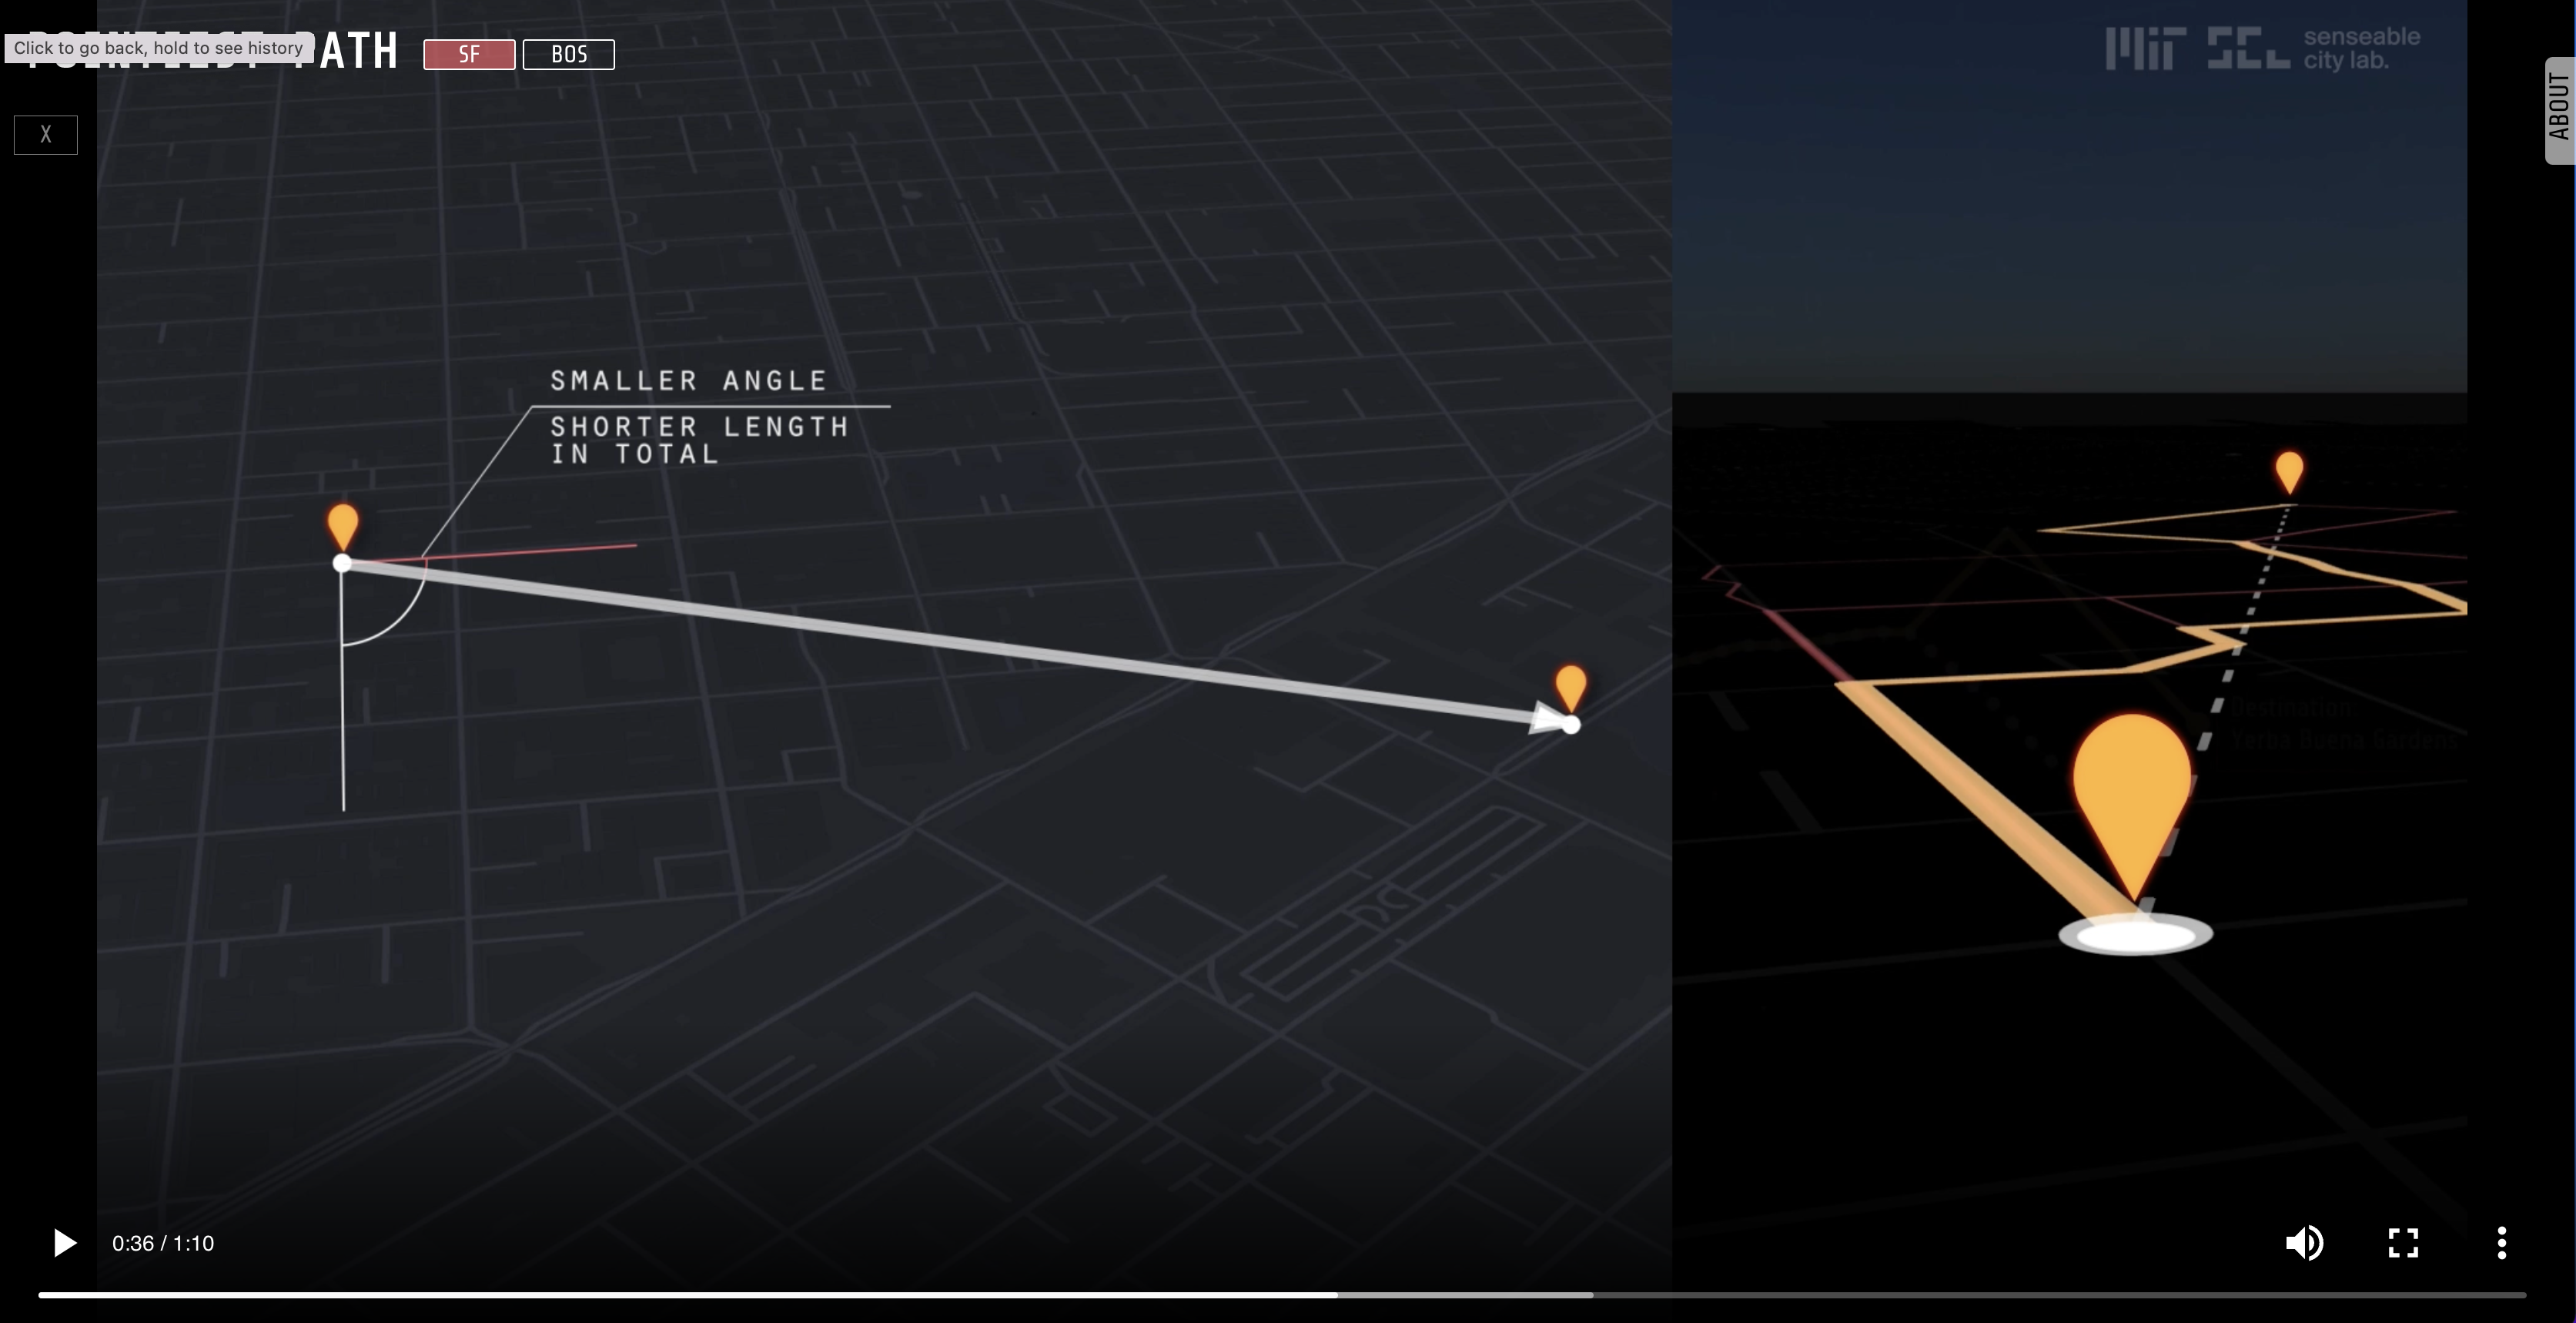
The analysis showed that instead of choosing shortest routes, pedestrians chose routes that were slightly longer but more directly point towards the destination — the pointiest paths.
 .
. 
︎︎︎ Data Visualization
︎︎︎ Go Back