#DataVisualization
Pointiest Path
; Revealing pedestrian behavior patterns
MIT Senseable City Lab | 2021
Role: Data visualization, Video
Tools: Deck.gl, React, Adobe AfterEffect
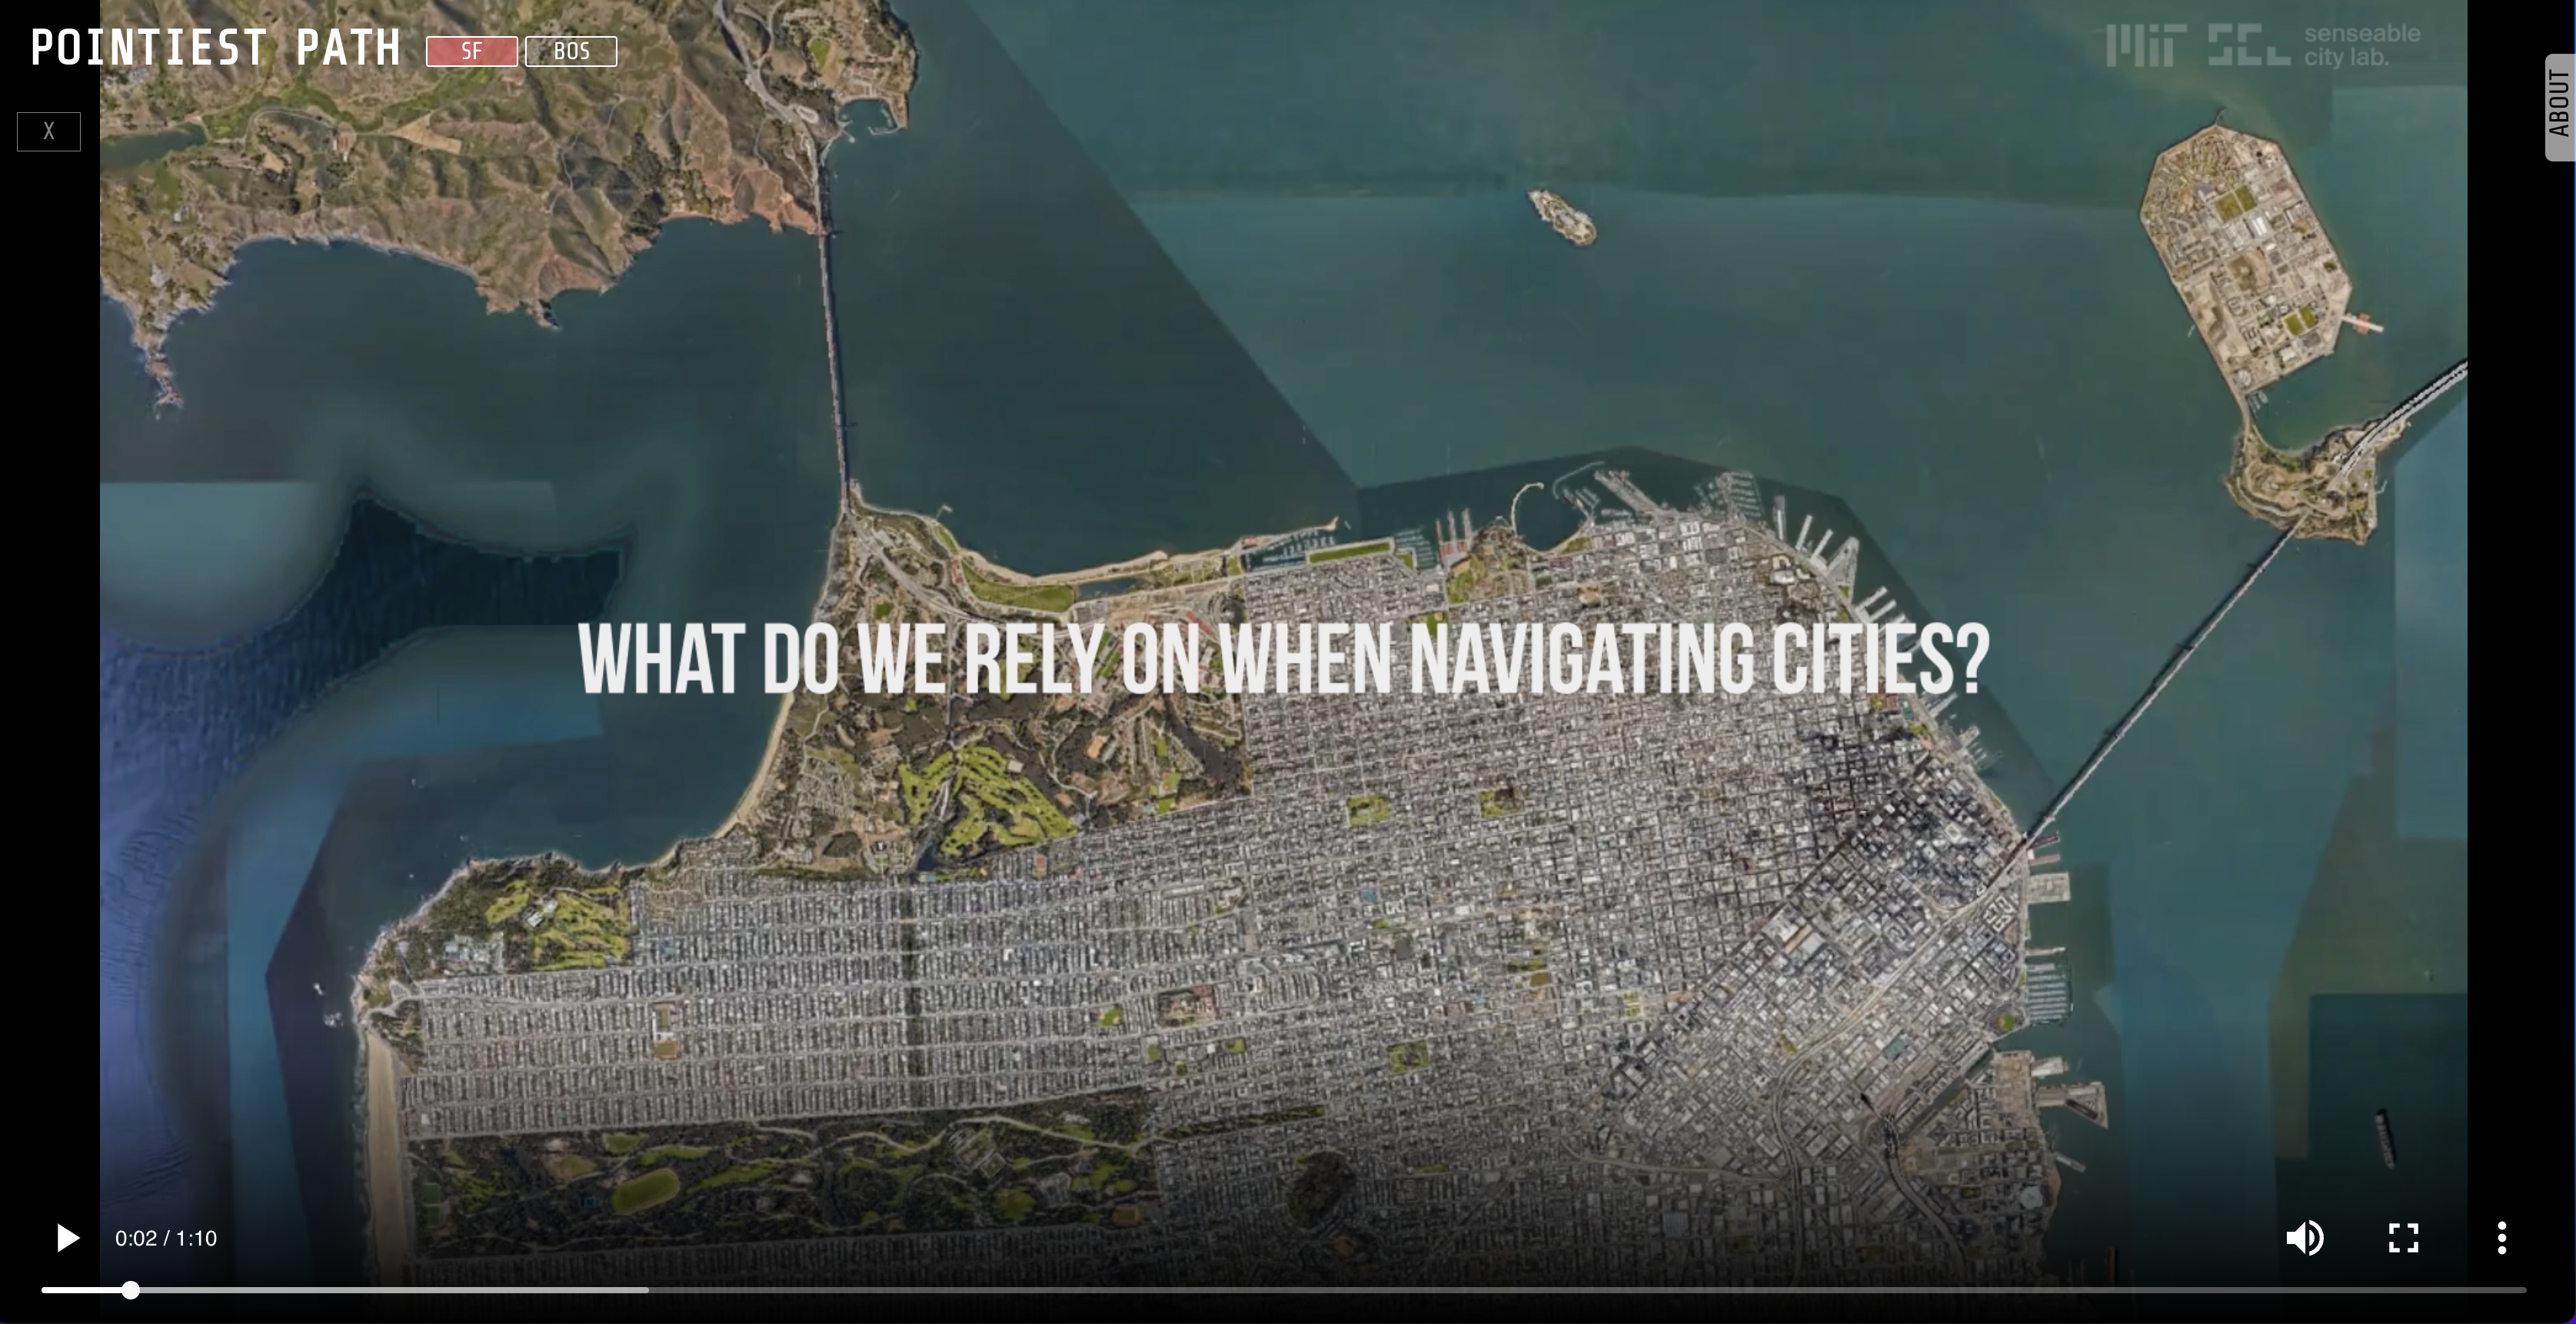
> How do people decide which way to go
![]()
![]()
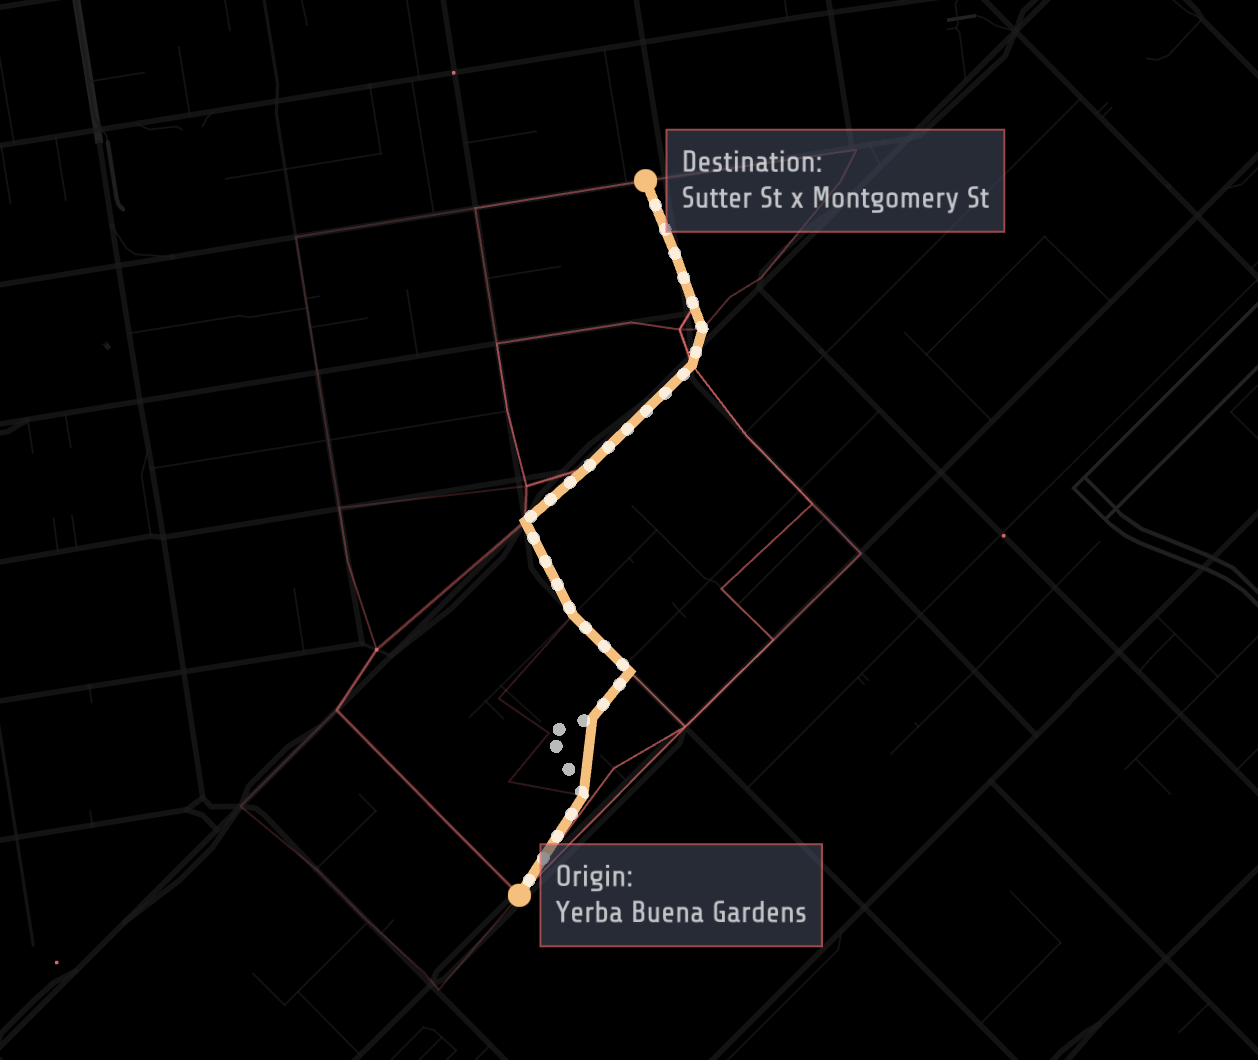
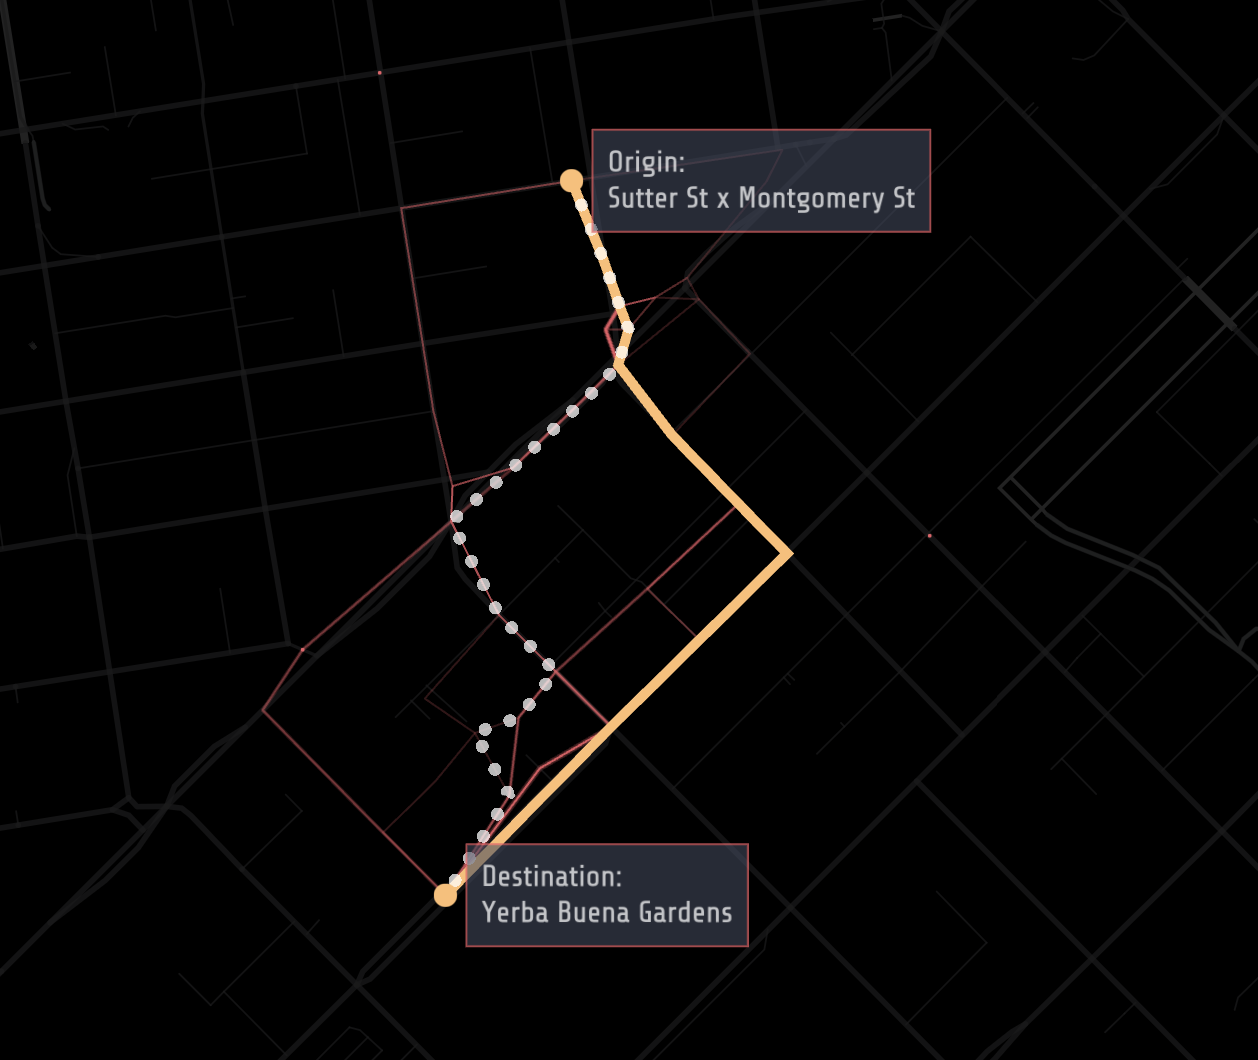
The analysis showed that instead of choosing shortest routes, pedestrians chose routes that were slightly longer but more directly point towards the destination — the pointiest paths.
![]() .
. ![]()
︎︎︎ Data Visualization
︎︎︎ Go Back
Pointiest Path
; Revealing pedestrian behavior patterns MIT Senseable City Lab | 2021
Role: Data visualization, Video
Tools: Deck.gl, React, Adobe AfterEffect
> How do people decide which way to go
when they walk around the city?
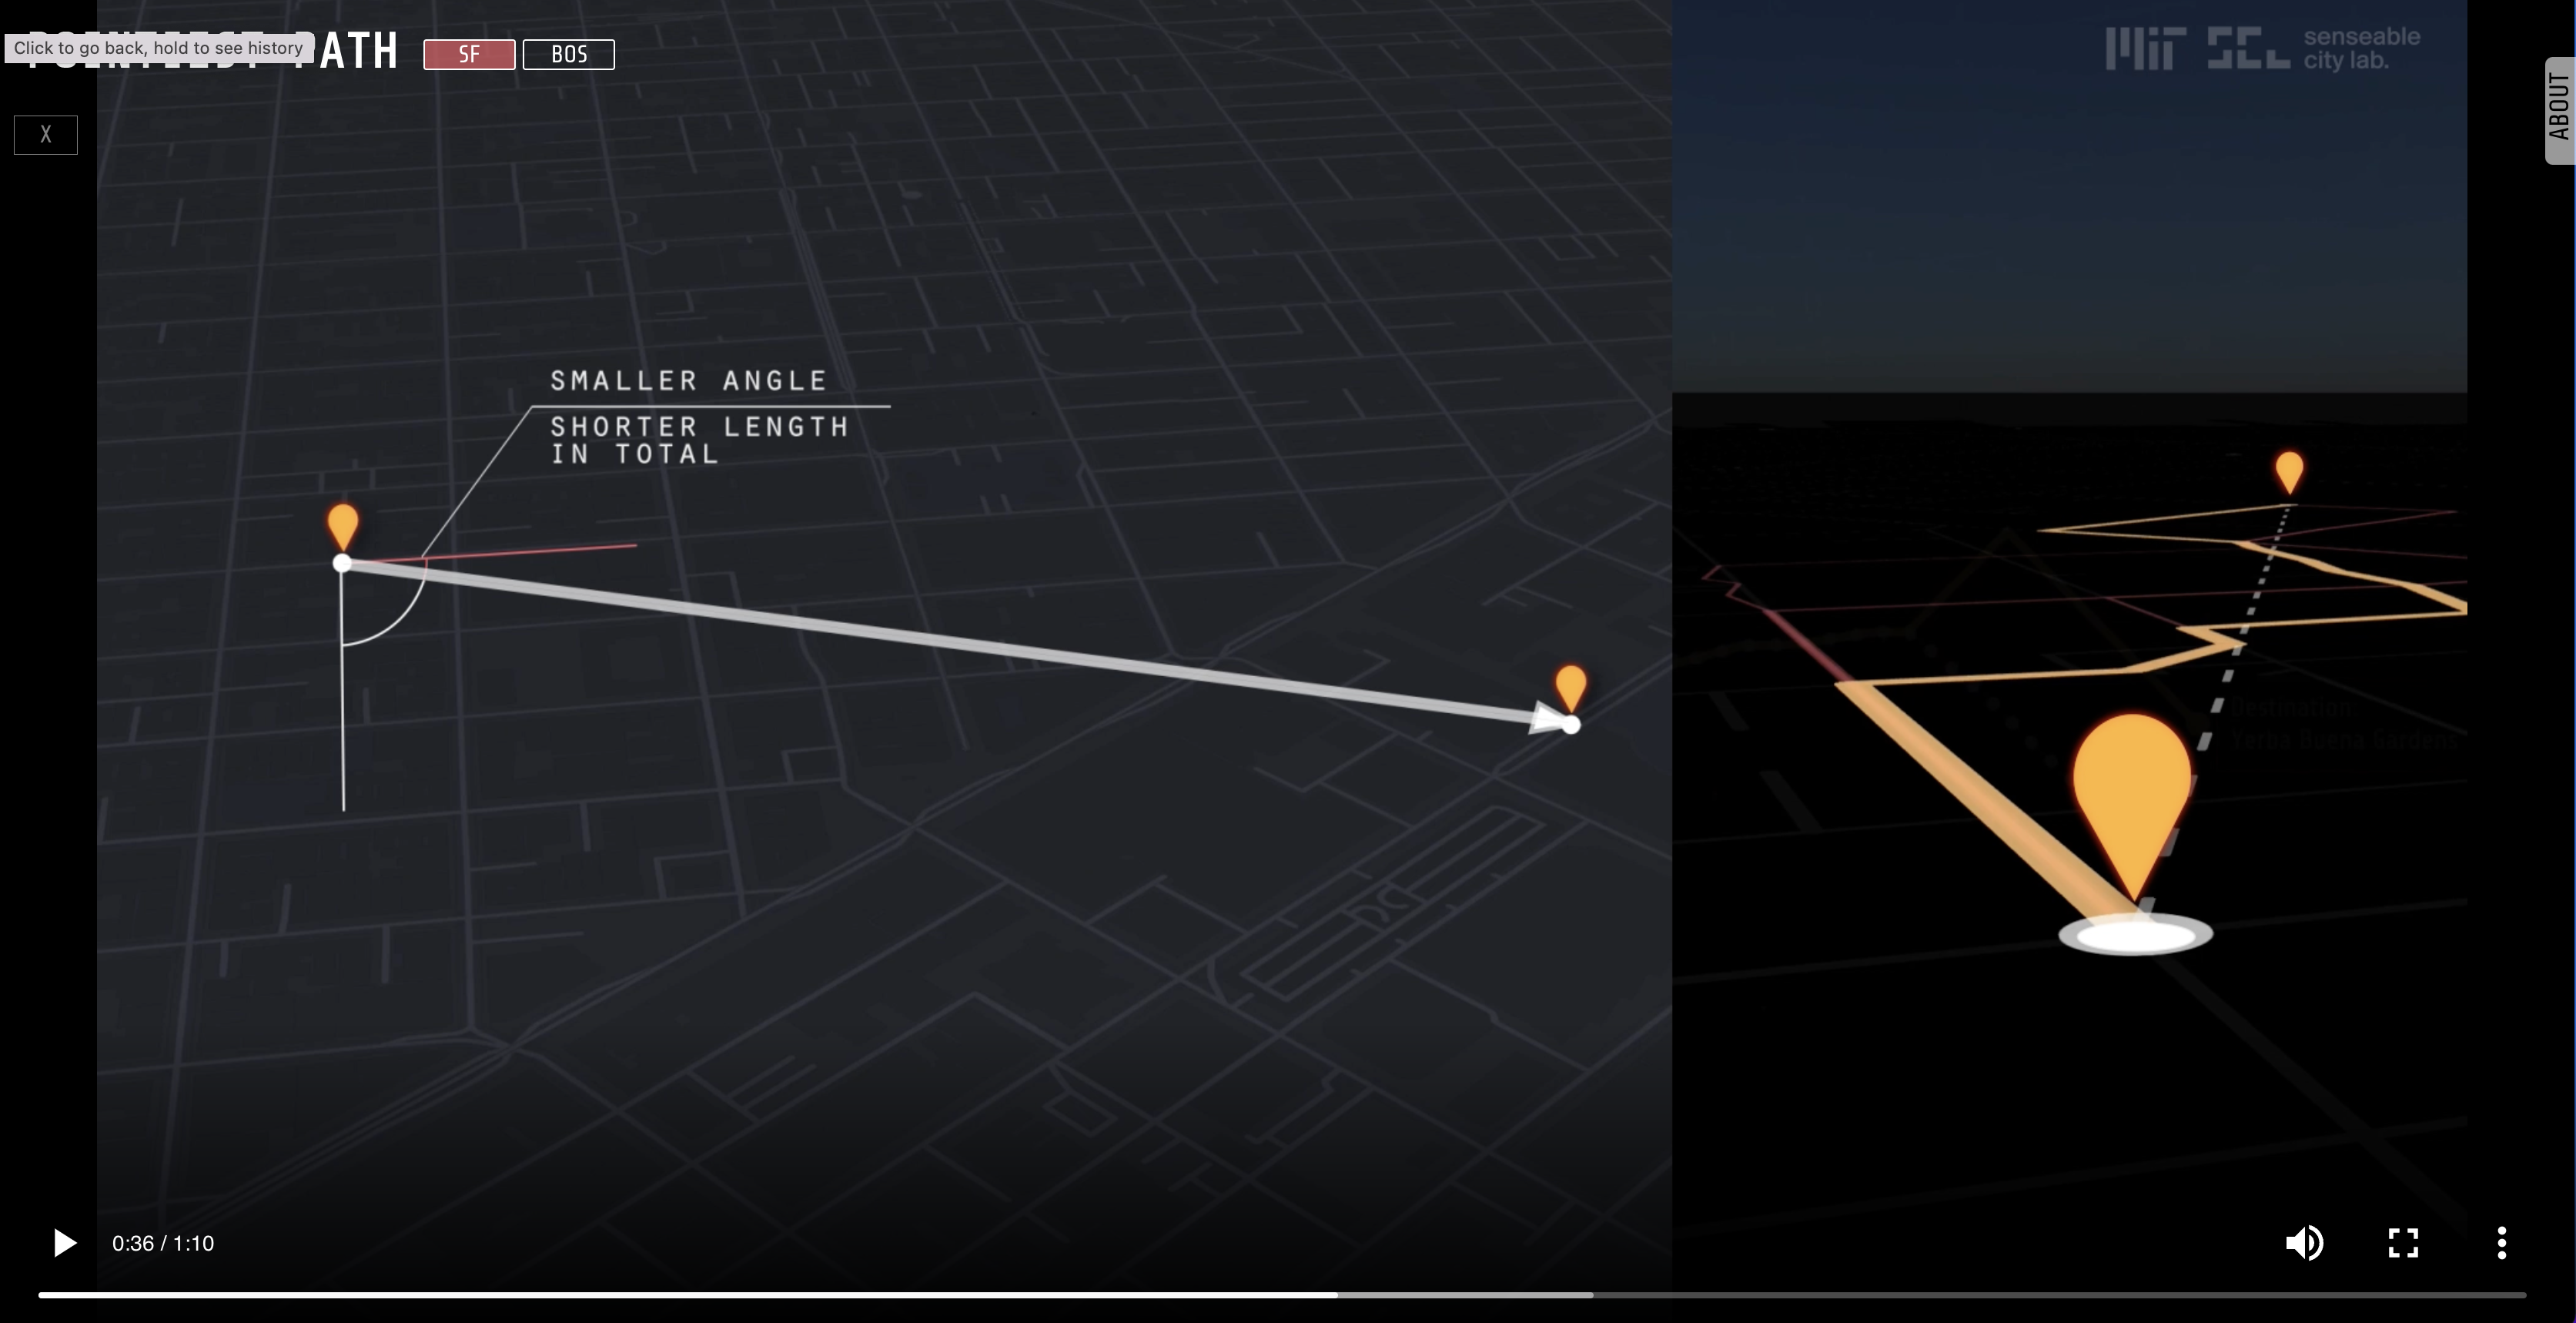
The analysis showed that instead of choosing shortest routes, pedestrians chose routes that were slightly longer but more directly point towards the destination — the pointiest paths.
 .
. 
︎︎︎ Data Visualization
︎︎︎ Go Back