#Data-driven #Sensor #DataVisualization #TacticalUrbanism #PublicSpace
@SQ9
; What makes a successful public space?
MIT Department of Urban Studies and Planning | 2019
Instructor: Sarah Williams (Civic Data Design Lab)
Team: Wonyoung So, Moon Mengqi He
Duration: 2 months
Role: Furniture Ideation, Data visualization
Tools: Vega-lite, JavaScript
Photo credit: @SQ9 team
︎ Project website
Instructor: Sarah Williams (Civic Data Design Lab)
Team: Wonyoung So, Moon Mengqi He
Duration: 2 months
Role: Furniture Ideation, Data visualization
Tools: Vega-lite, JavaScript
Photo credit: @SQ9 team
︎ Project website
“Cultures and climates differ all over the world, but people are the same.
They’ll gather in public if you give them good places to do it.”
| Problem |
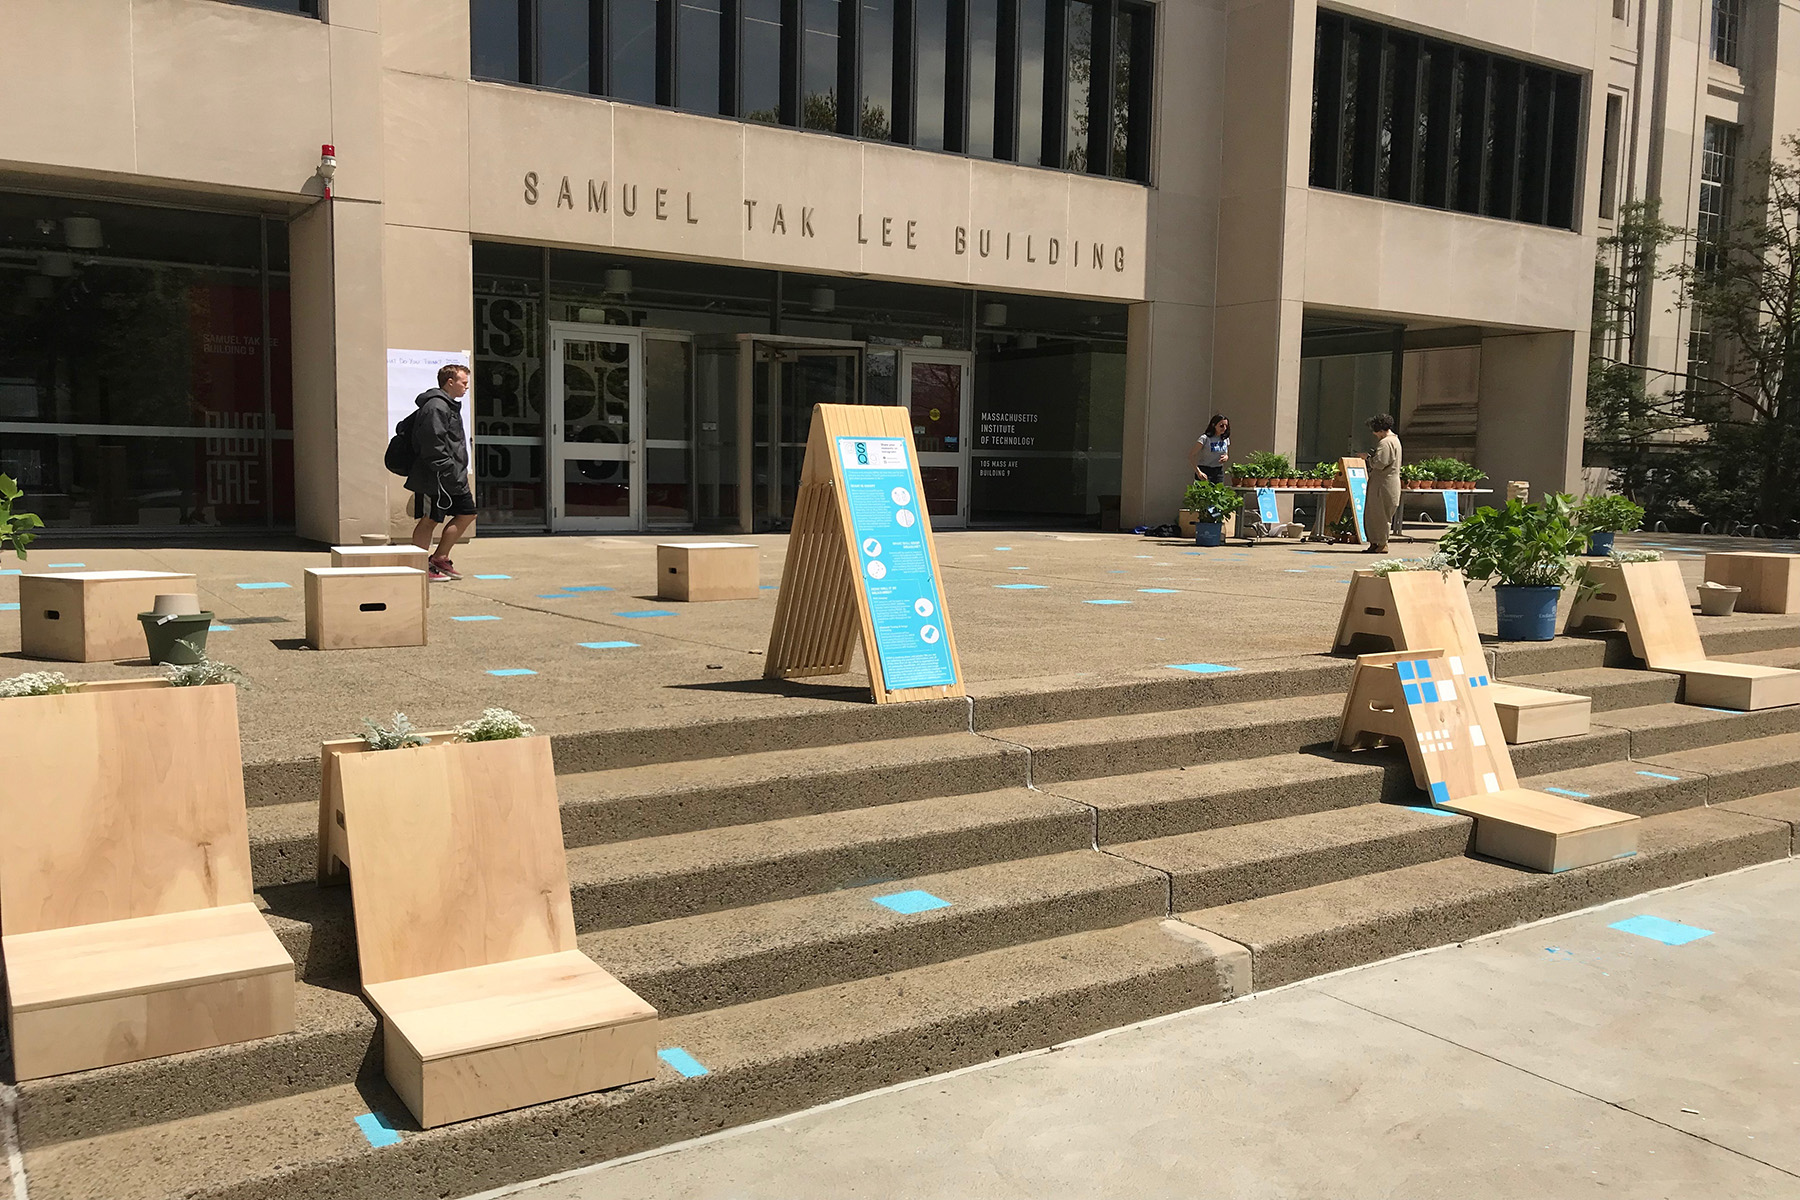
The entrance of MIT Building 9 (Department of Urban Science and Planning) is underutilized.
| Goal |
Having design intervention to activate the space and have people engaged. During the event, we measure how the place is utilized by using sensors and visualize people’s movement.
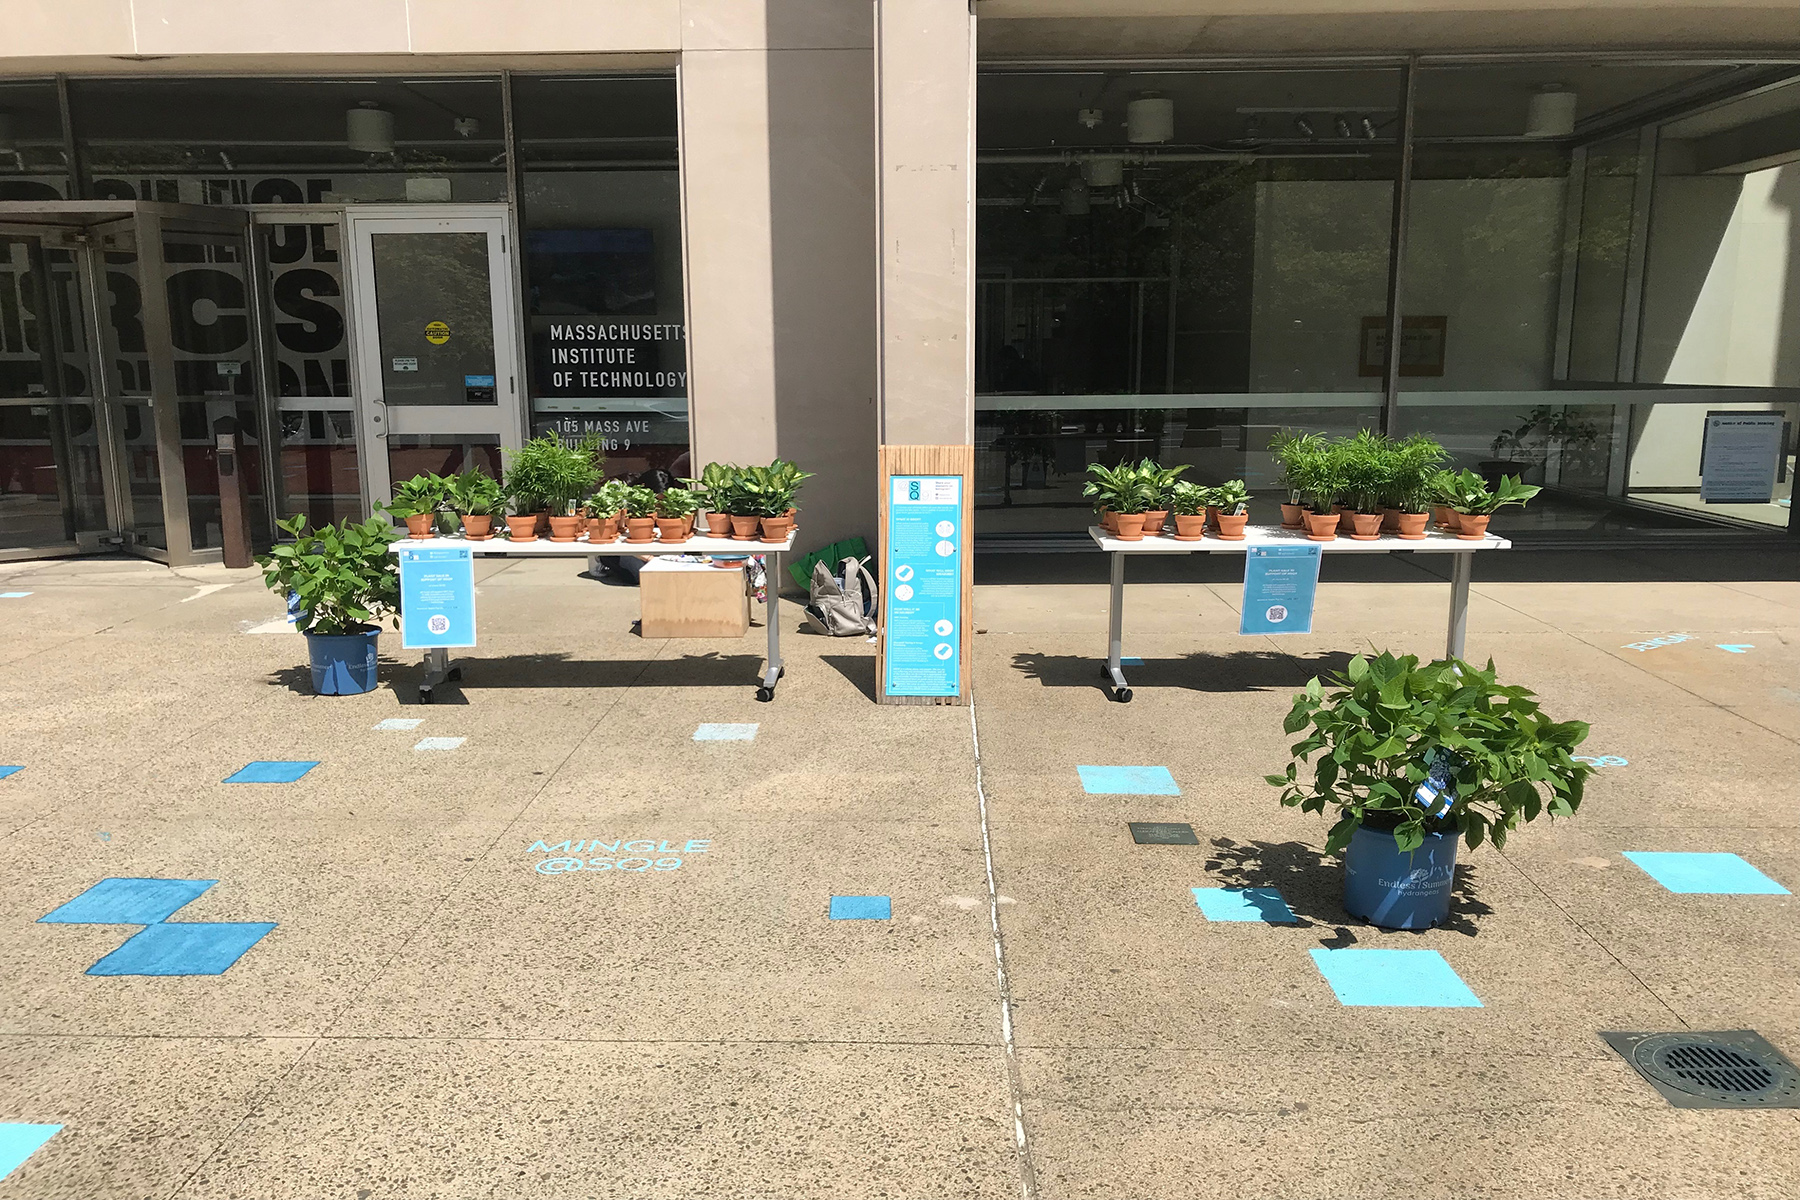
>>Tactical Urbanism Event was held to measure how physical interventions can activate and improve public spaces.

Plaza Design
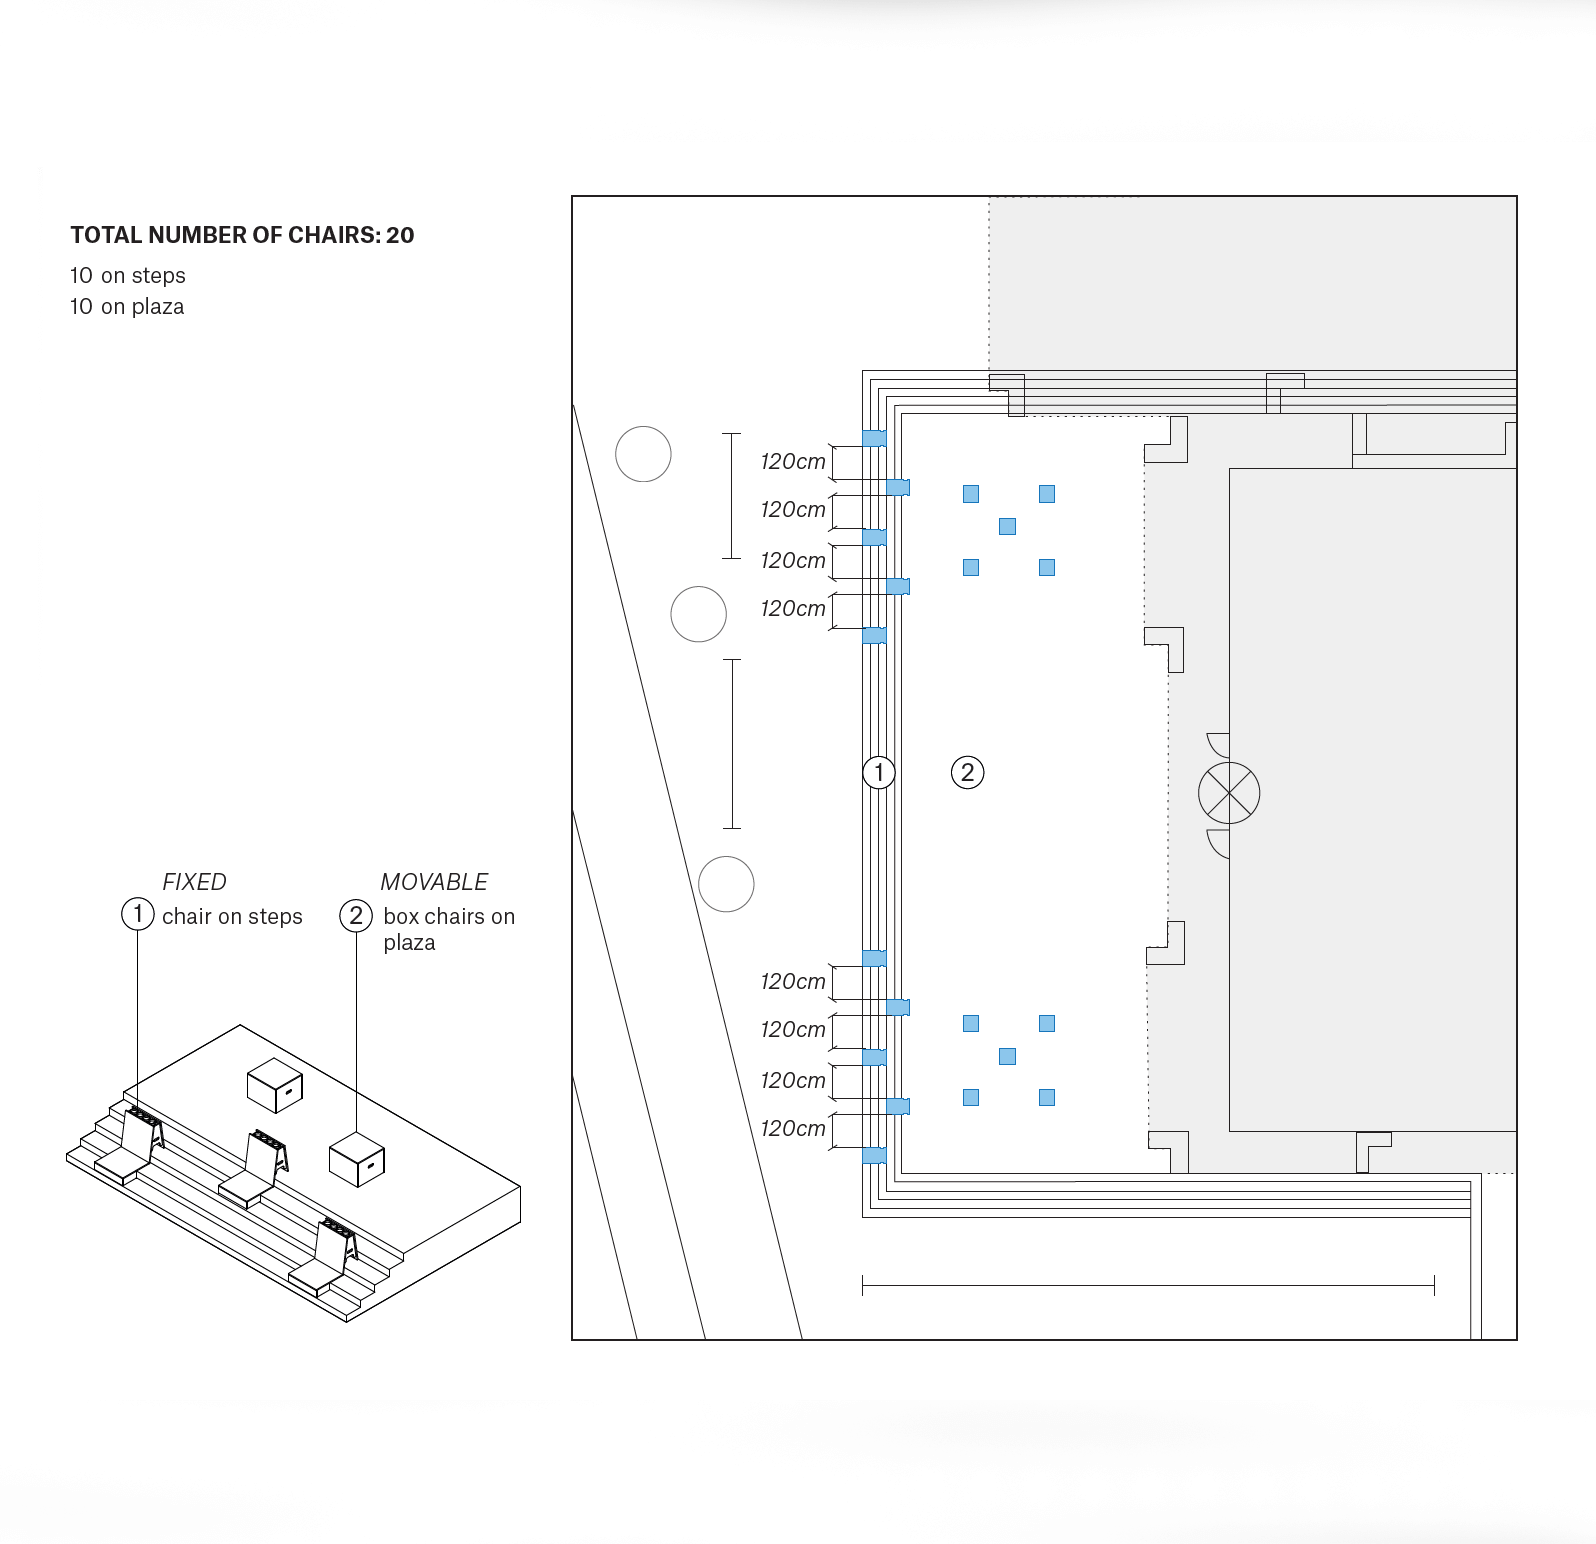 Tactical Urbanism plan of placing movable box chairs with sensors
 Data Sensing
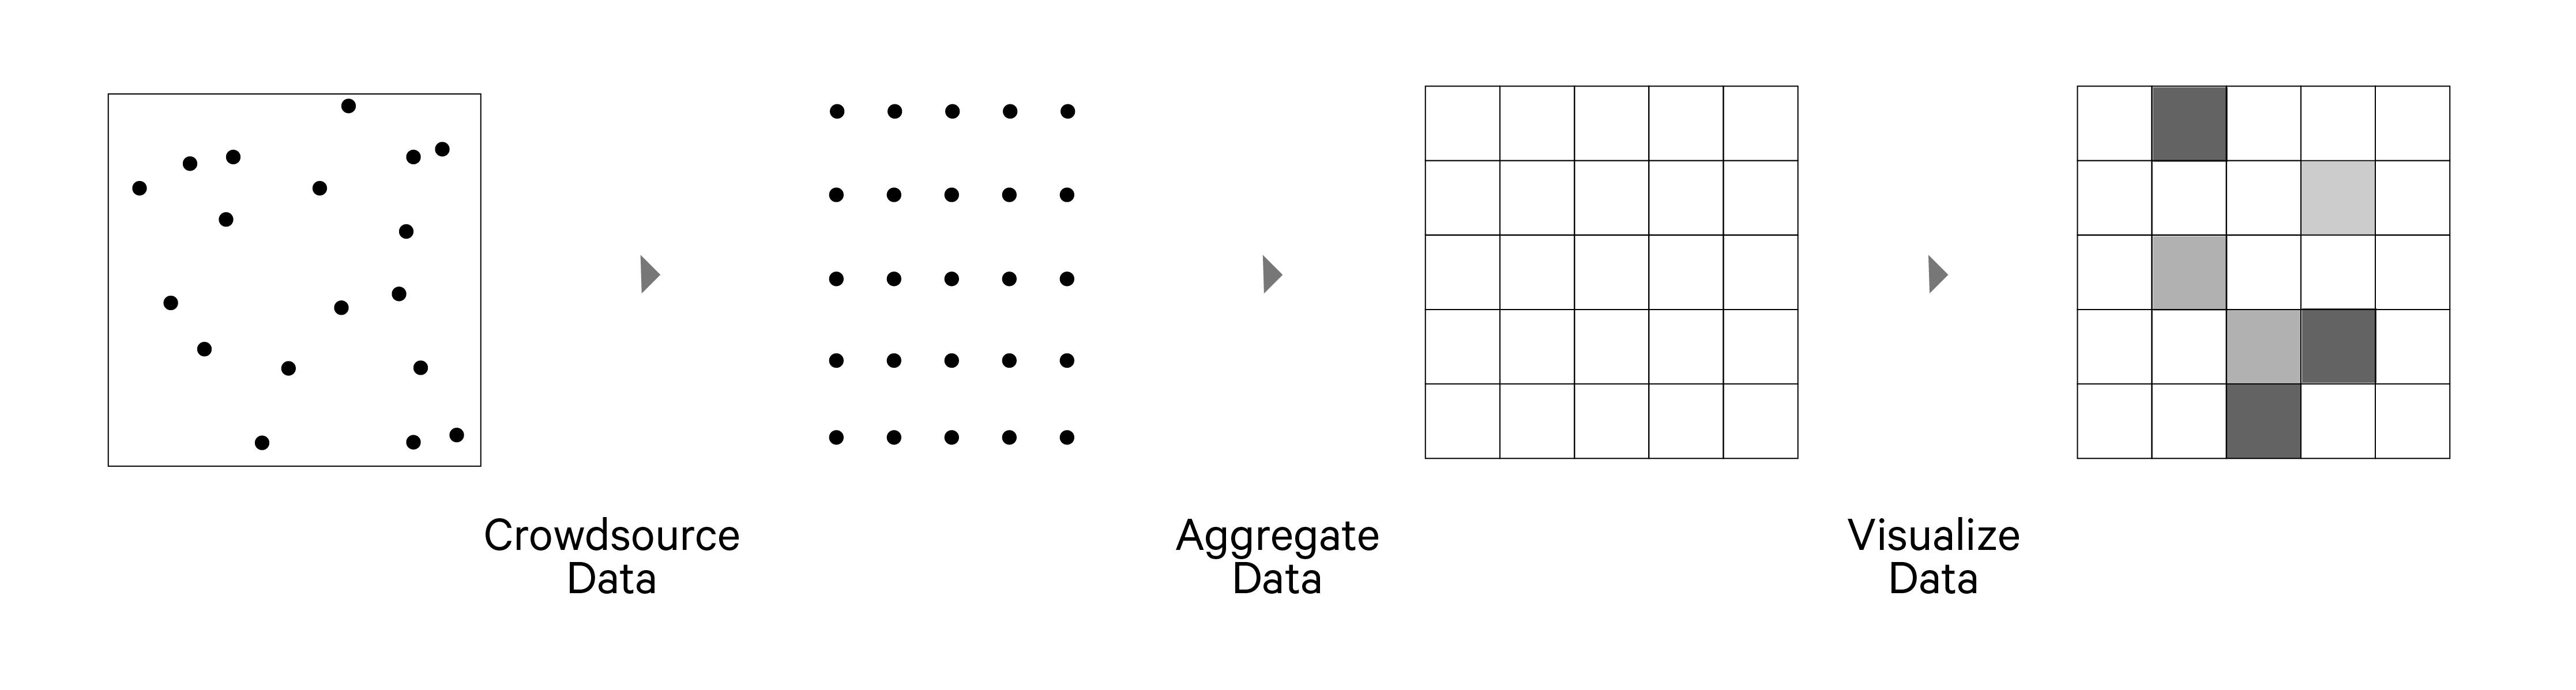
Sensors were used to measure activity throughout the @SQ9 event. Pedestrian traffic and furniture use were measured to see how effective physical interventions, like furniture and plants, were in activating @SQ9’s use as a public space.
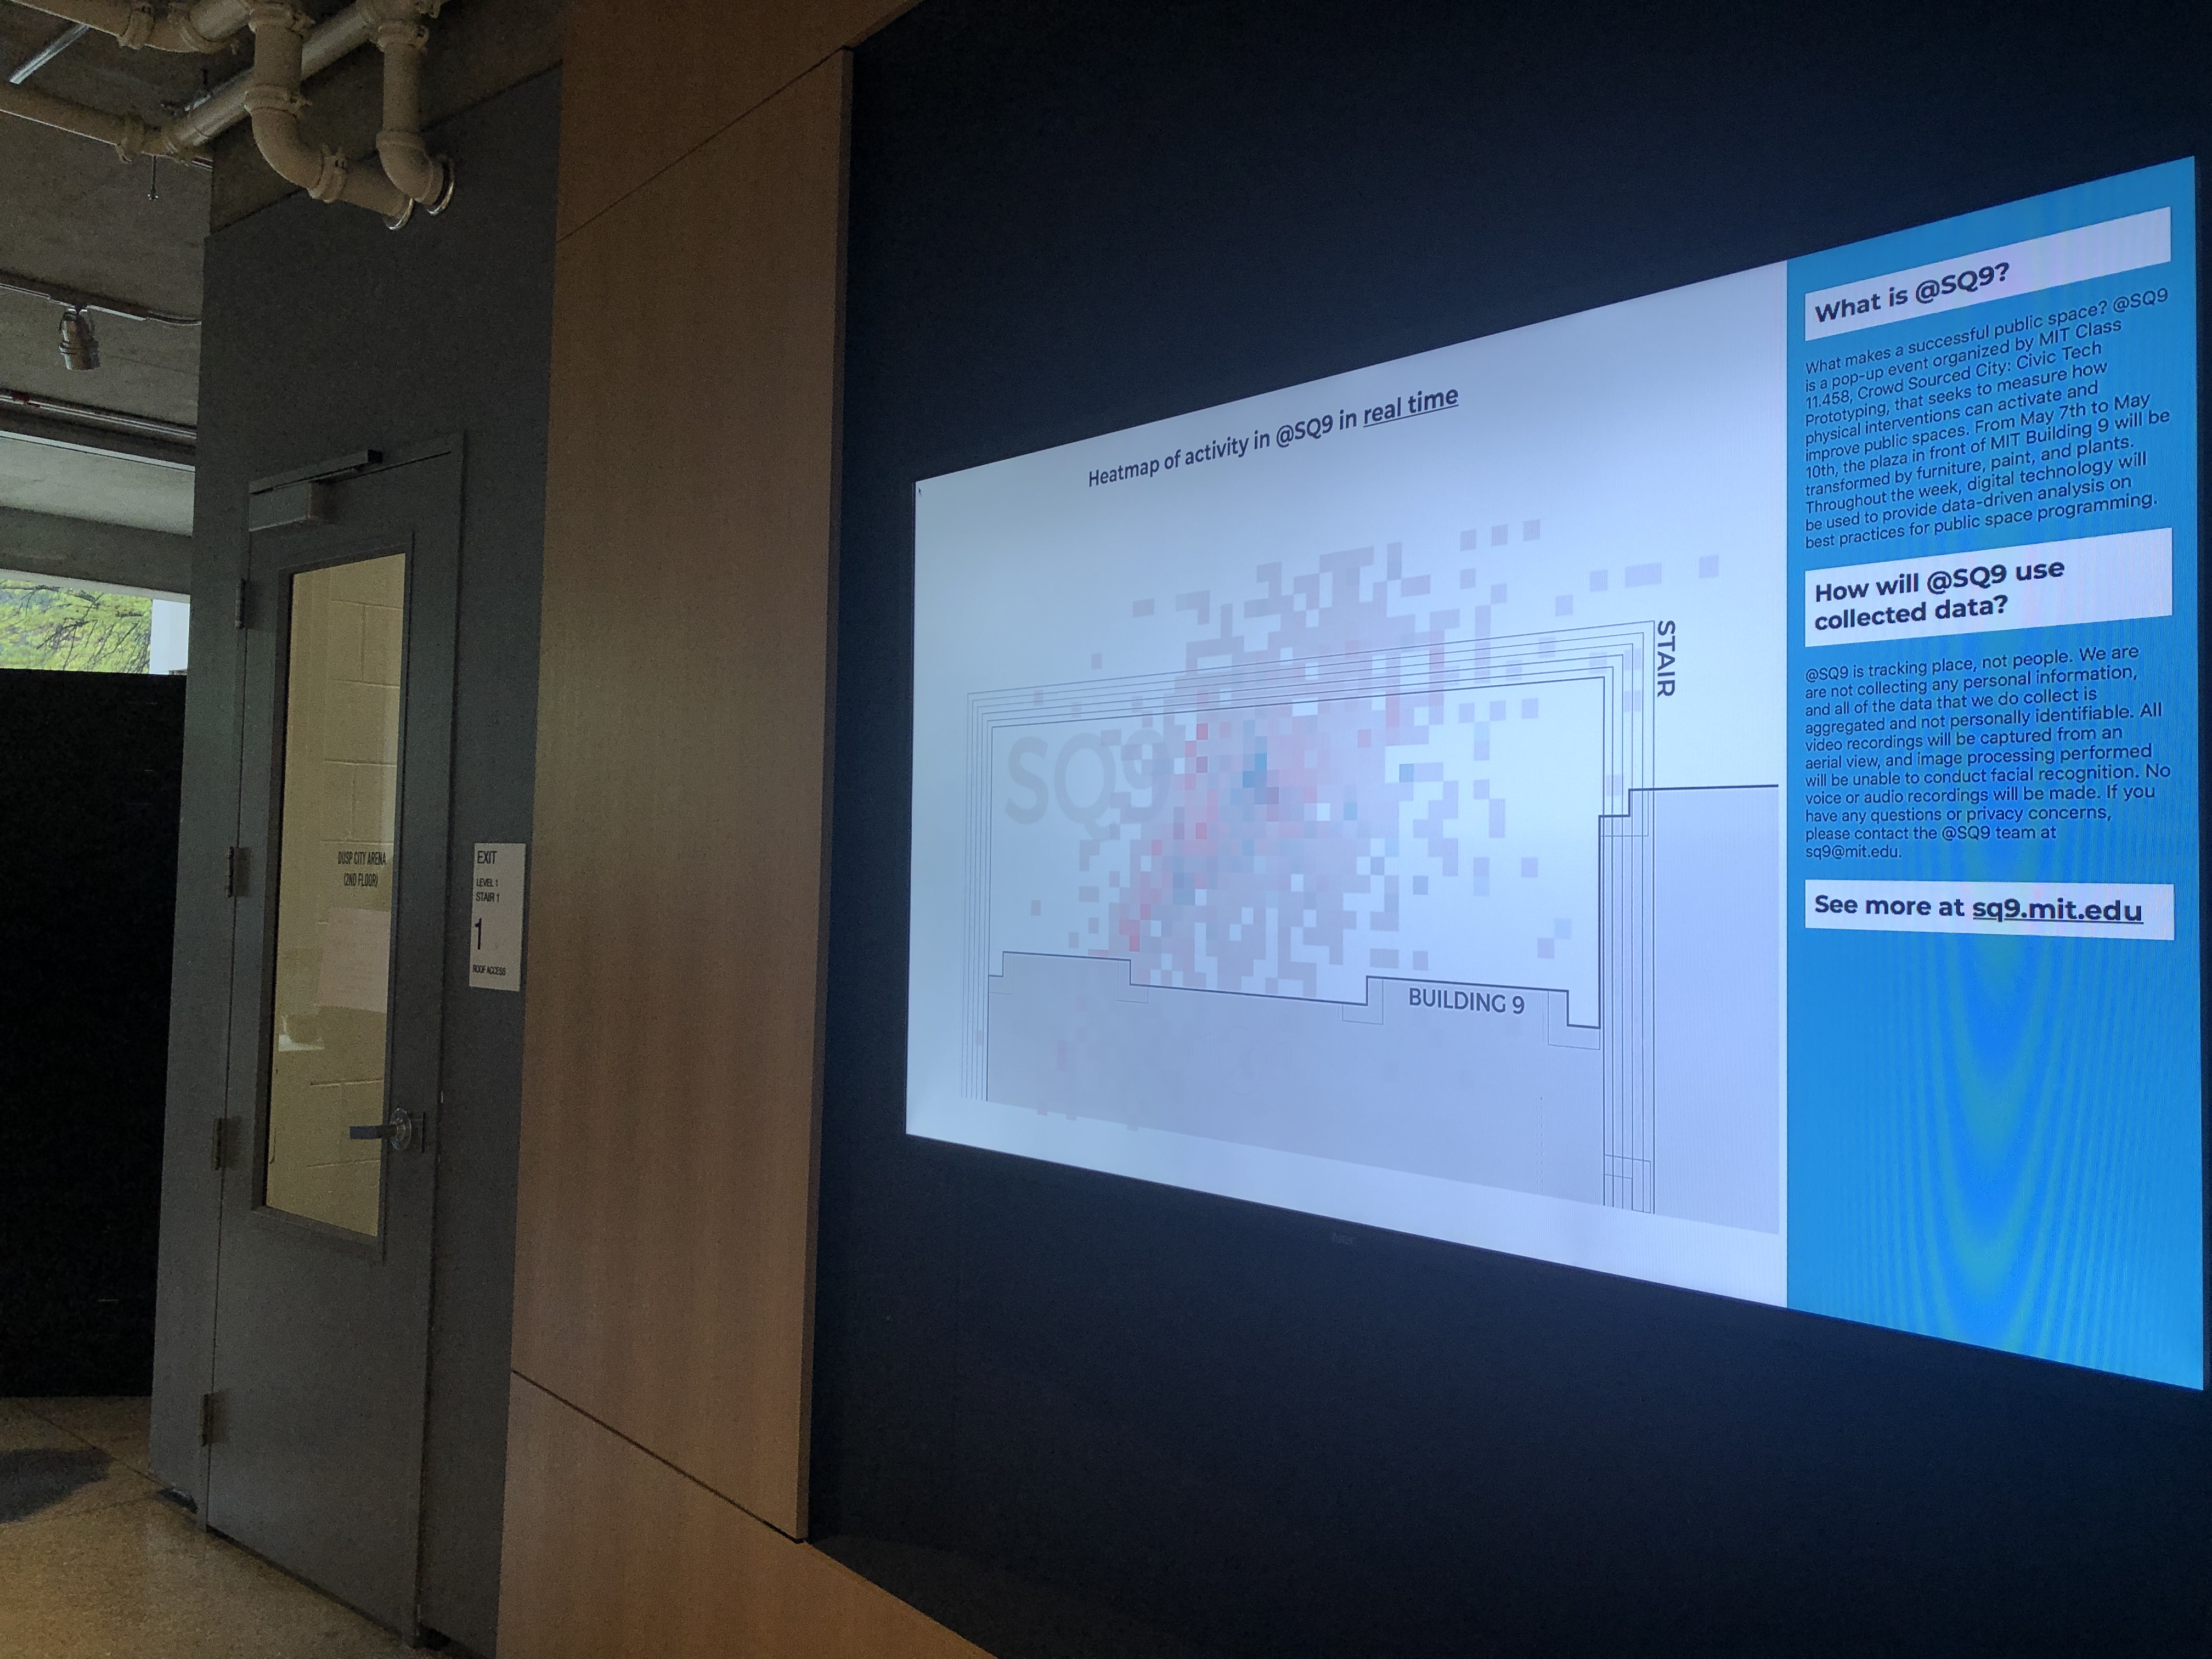
Our biggest concern was privacy issue.
@SQ9 tracked locations, not individuals.
We did not collect any personal information,
and all of the data were aggregated and were not personally identifiable.
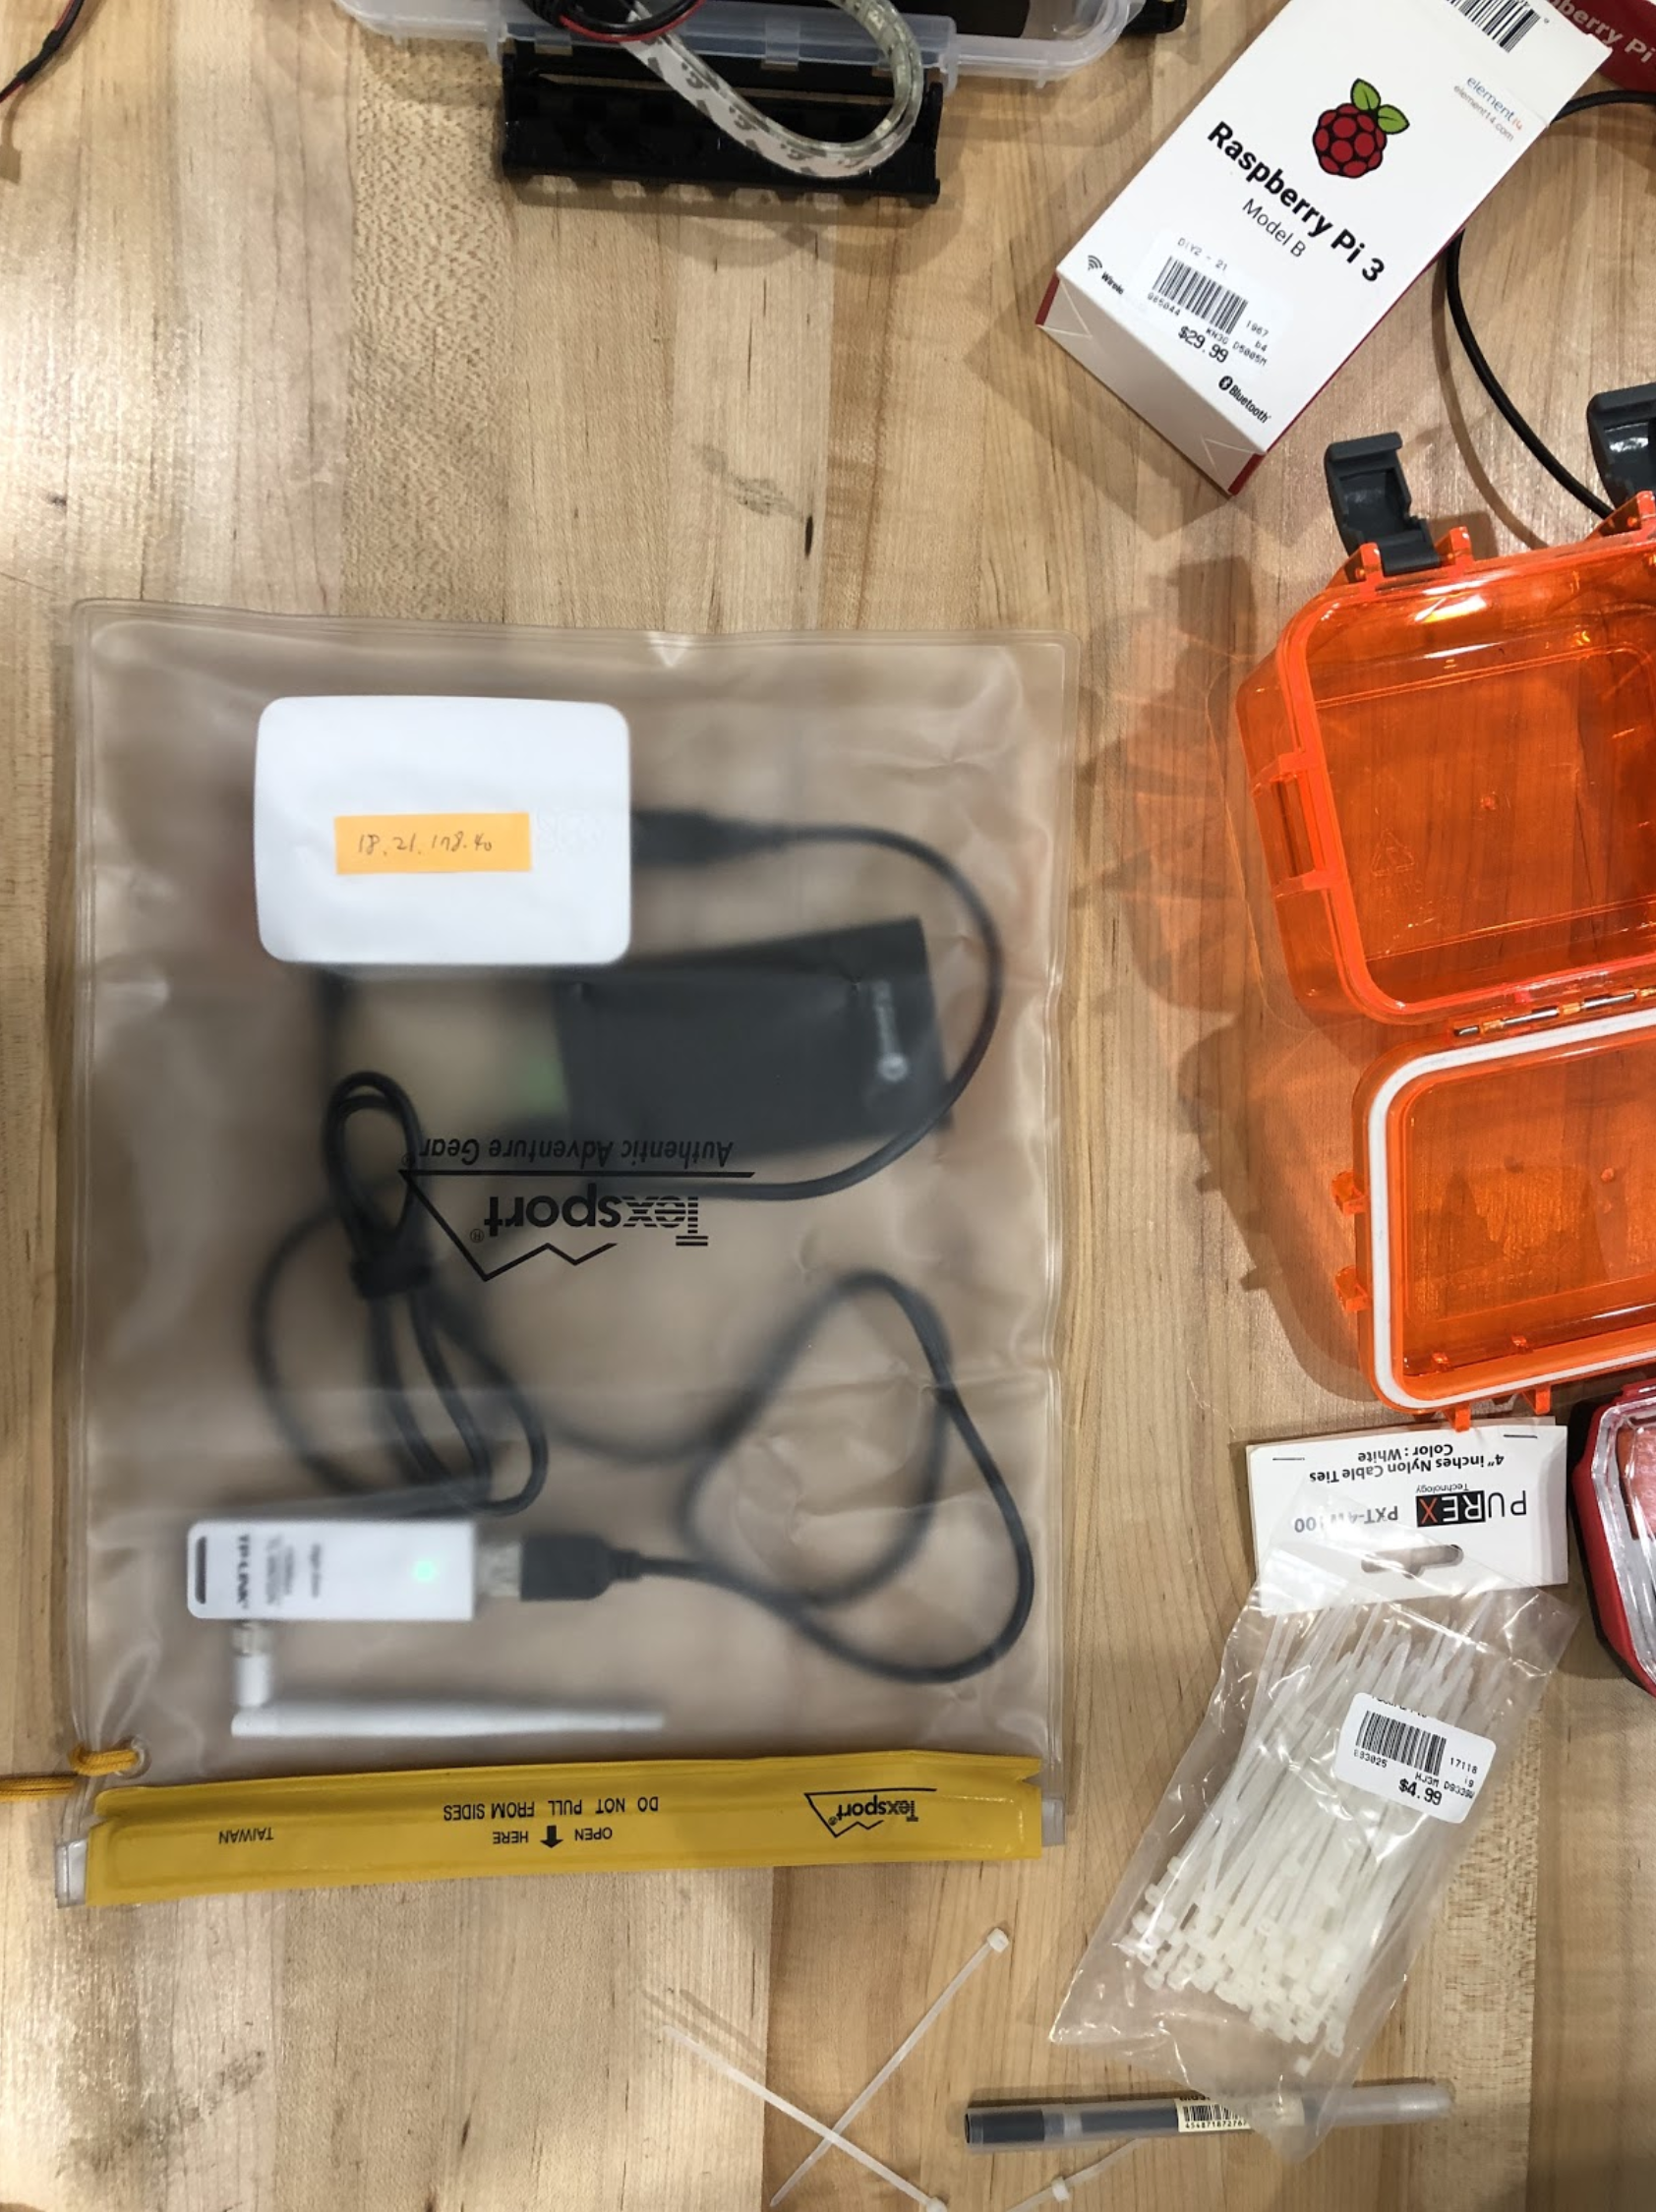

Bluetooth beacons inside the movable chairs and wifi sniffing technology were used to detect the location. It allowed us to analyze the usage of this place and help us potentially make a better decision making in terms of plaza design.
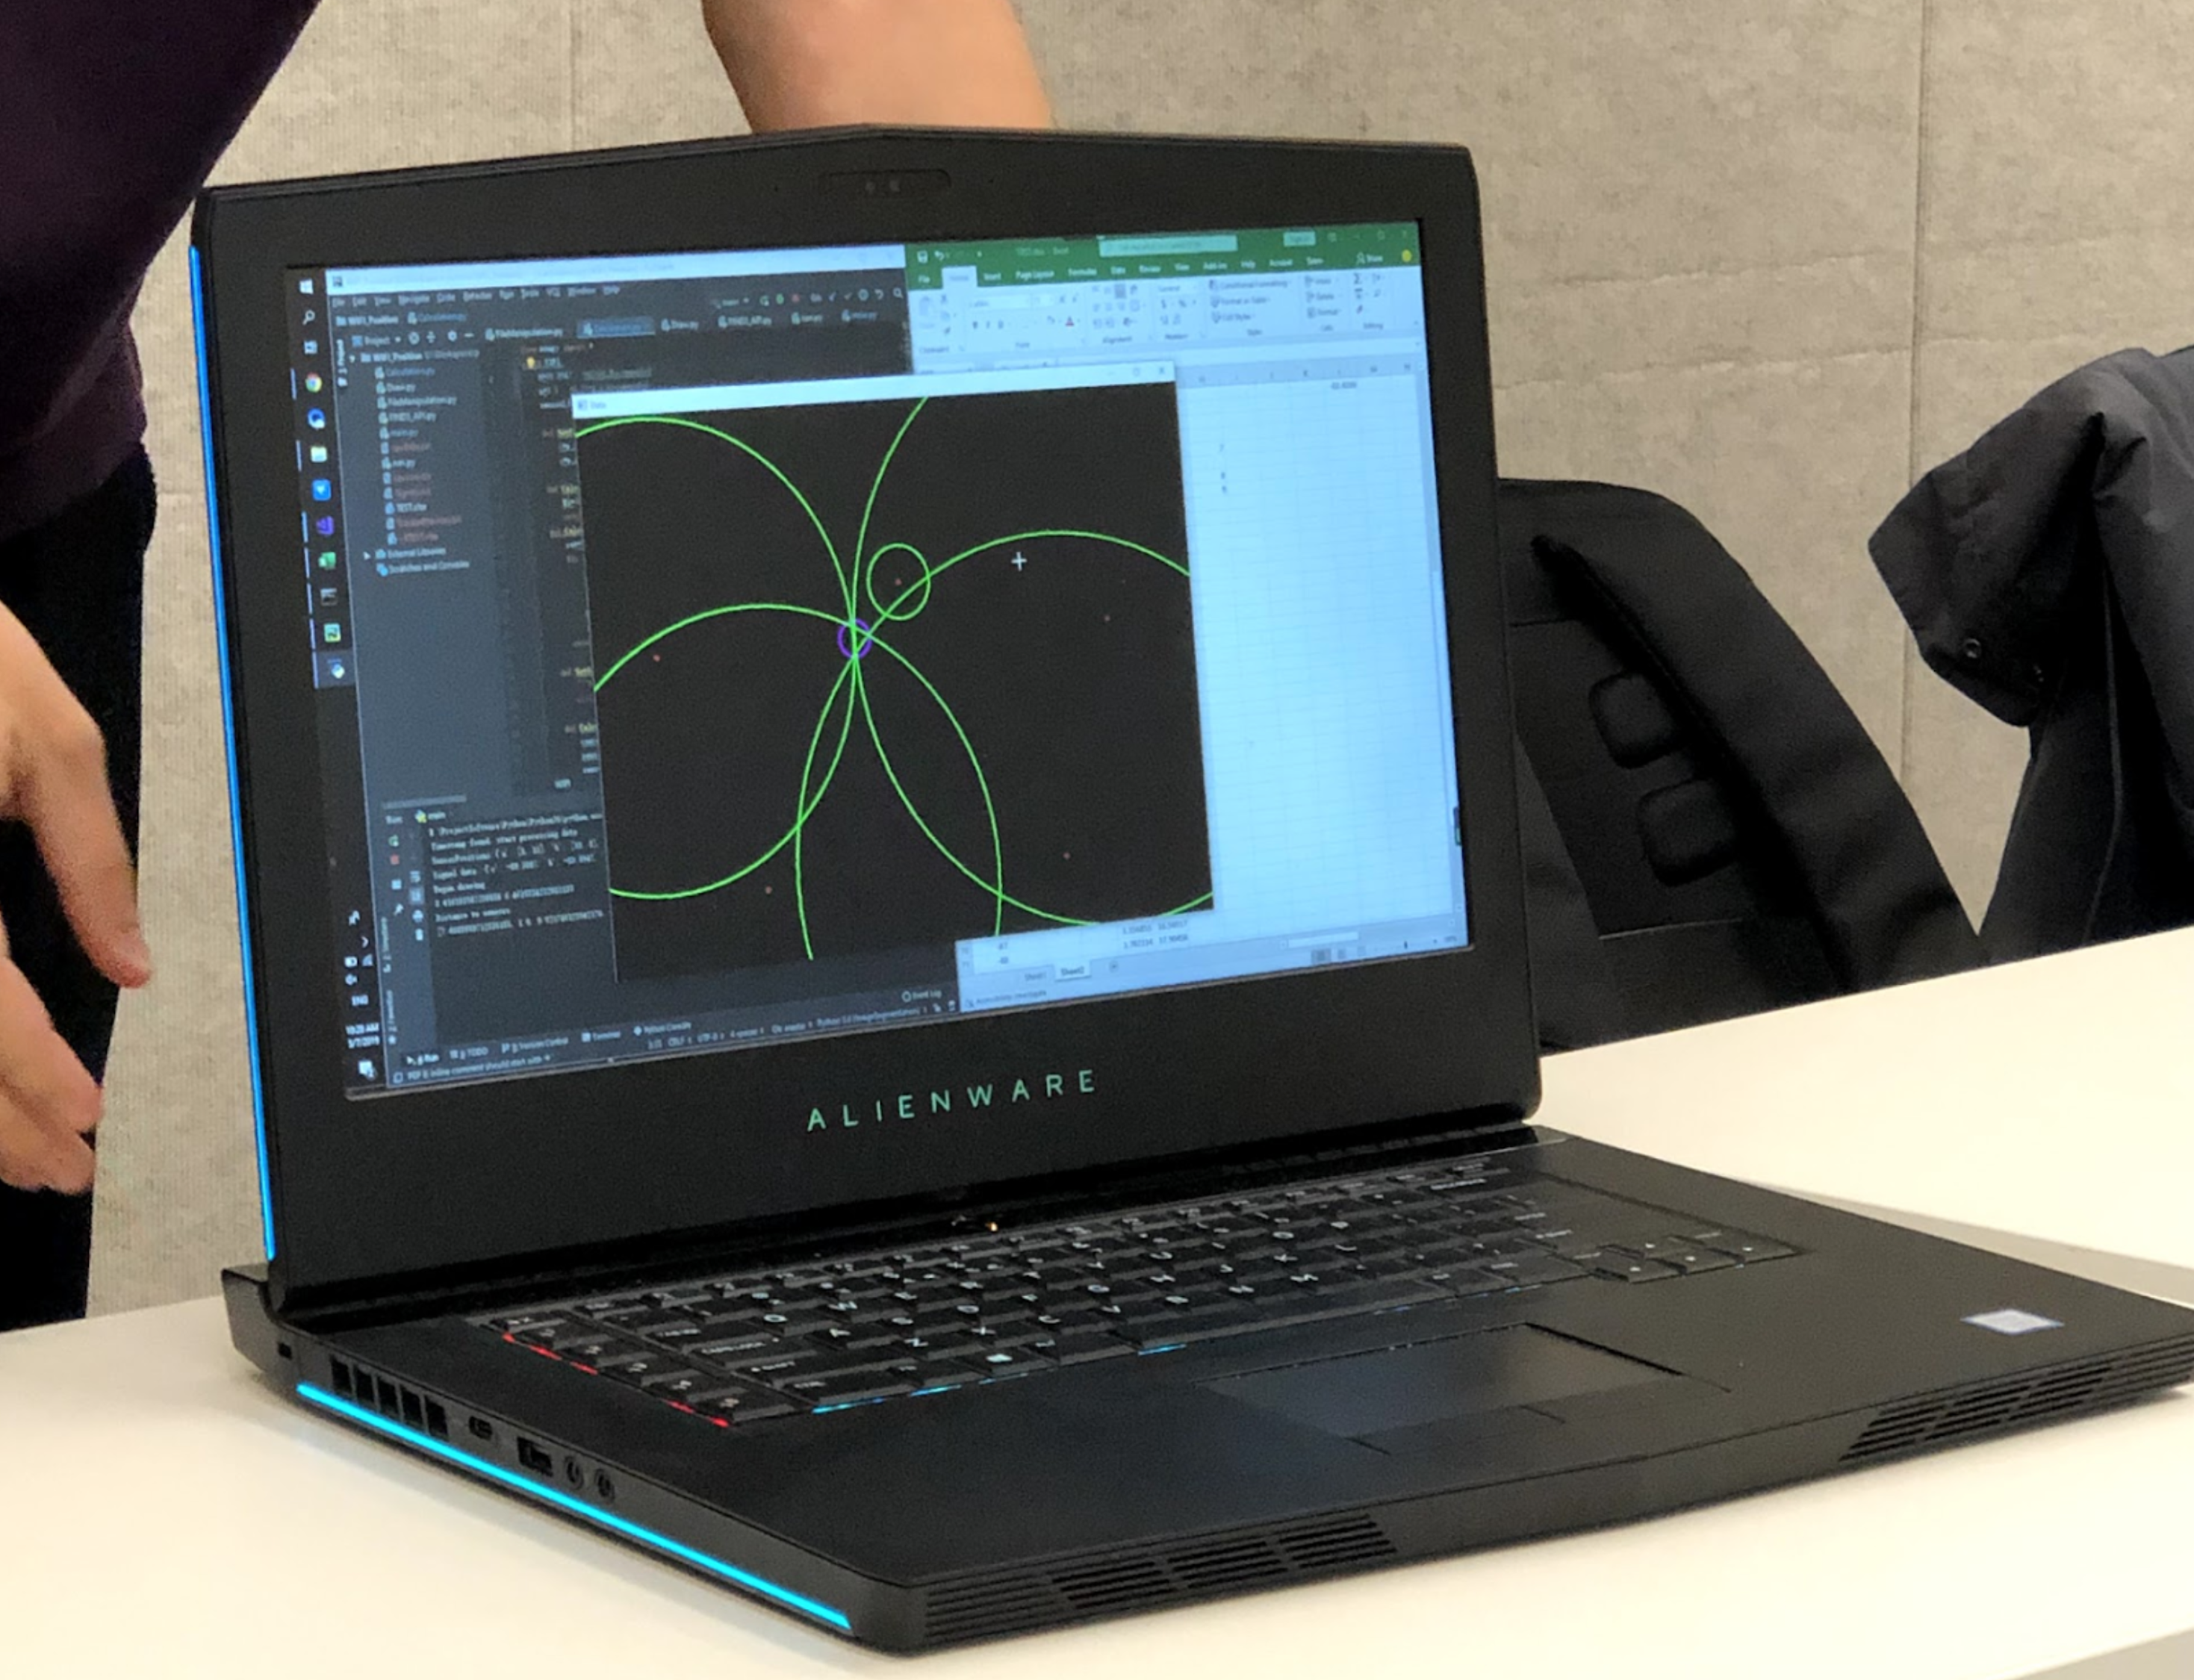 Triangulate the signals from wifi sensors to detect the smartphone locations
Data visualization
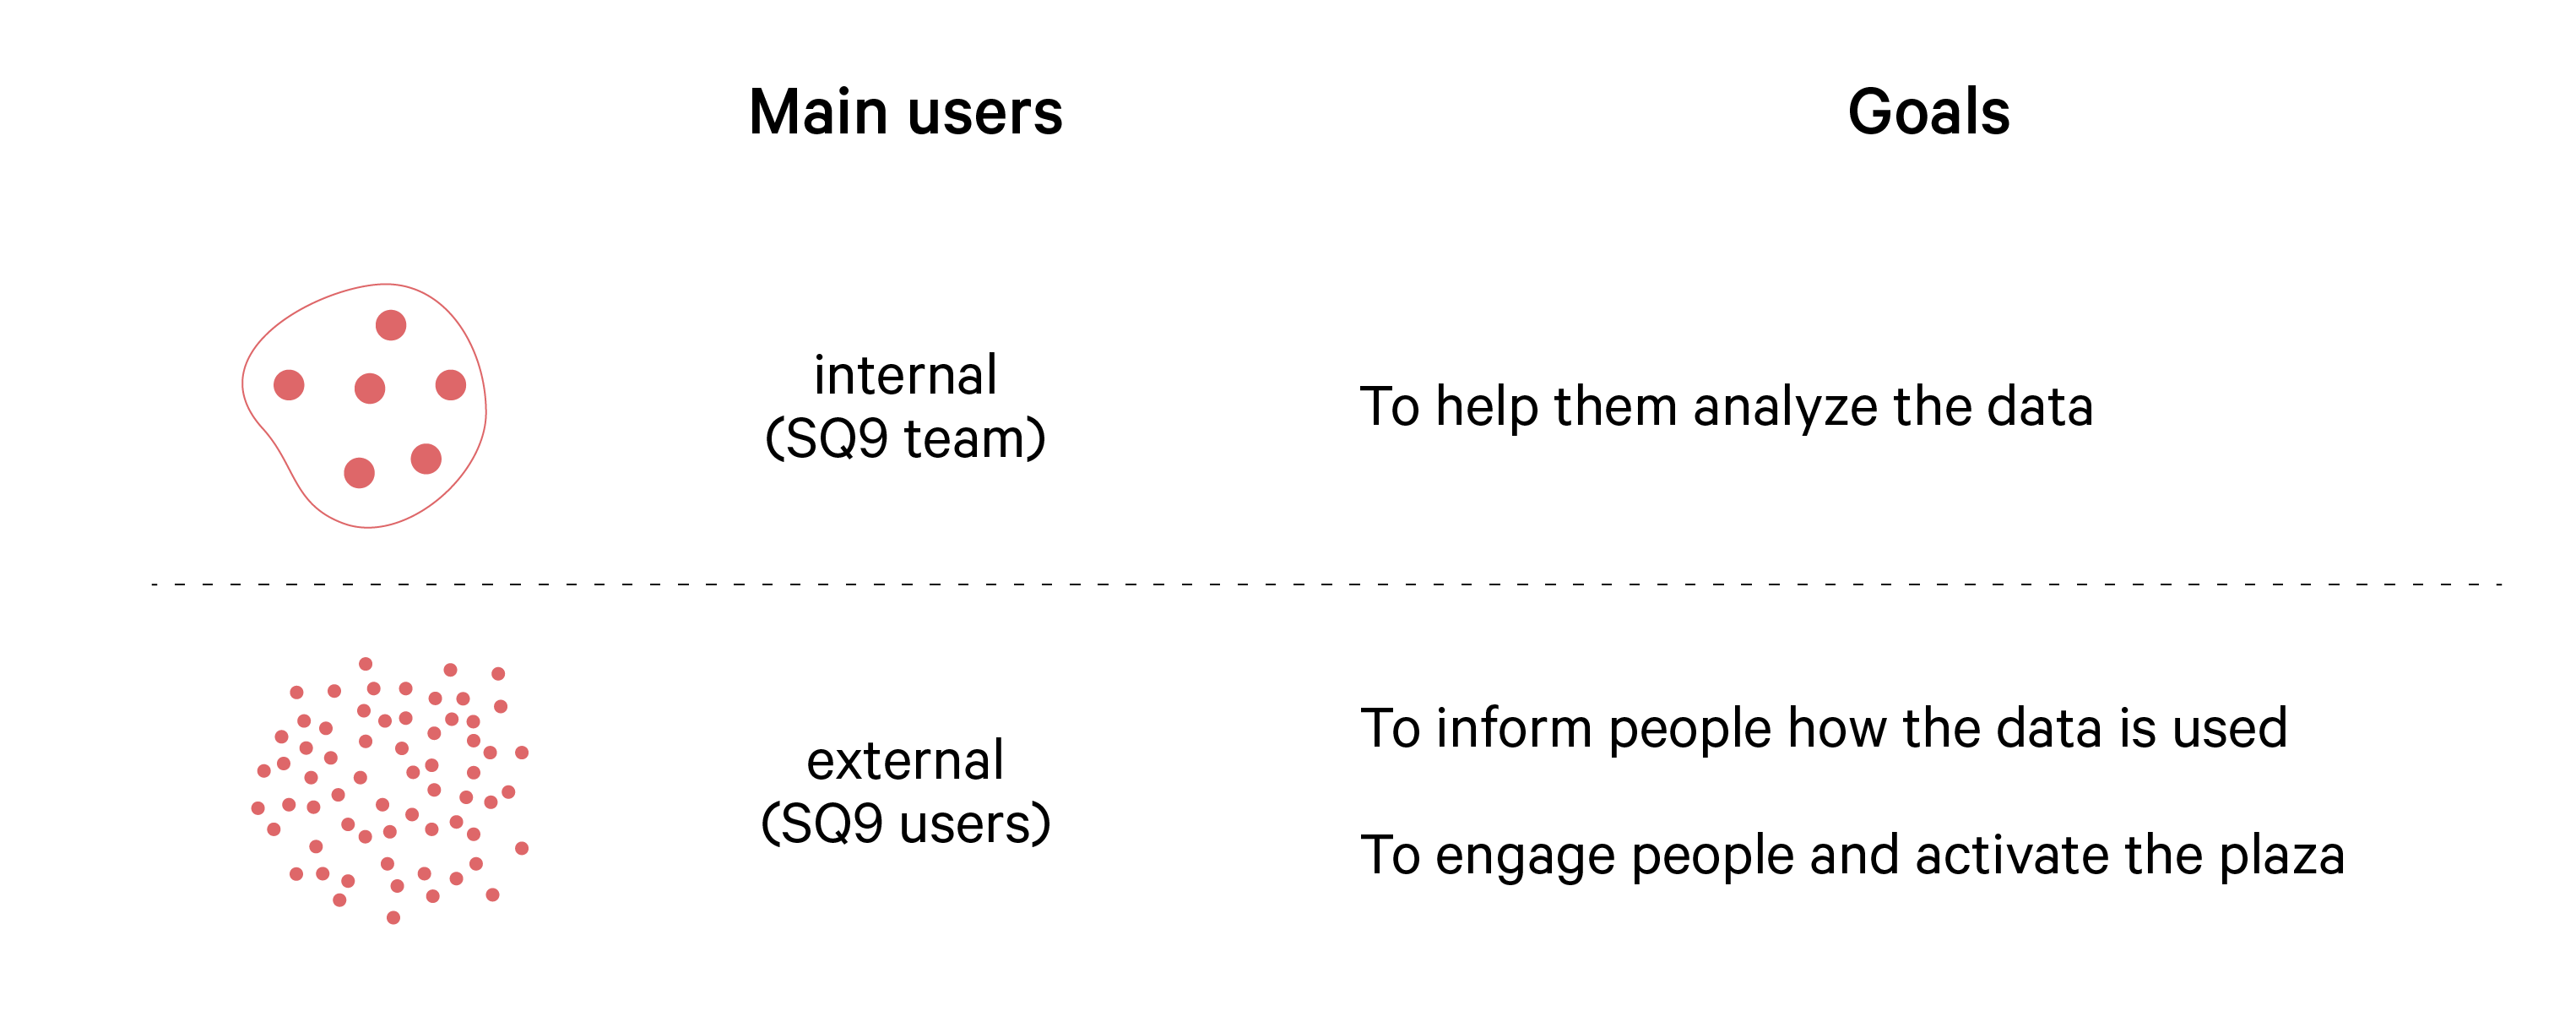
| Users |
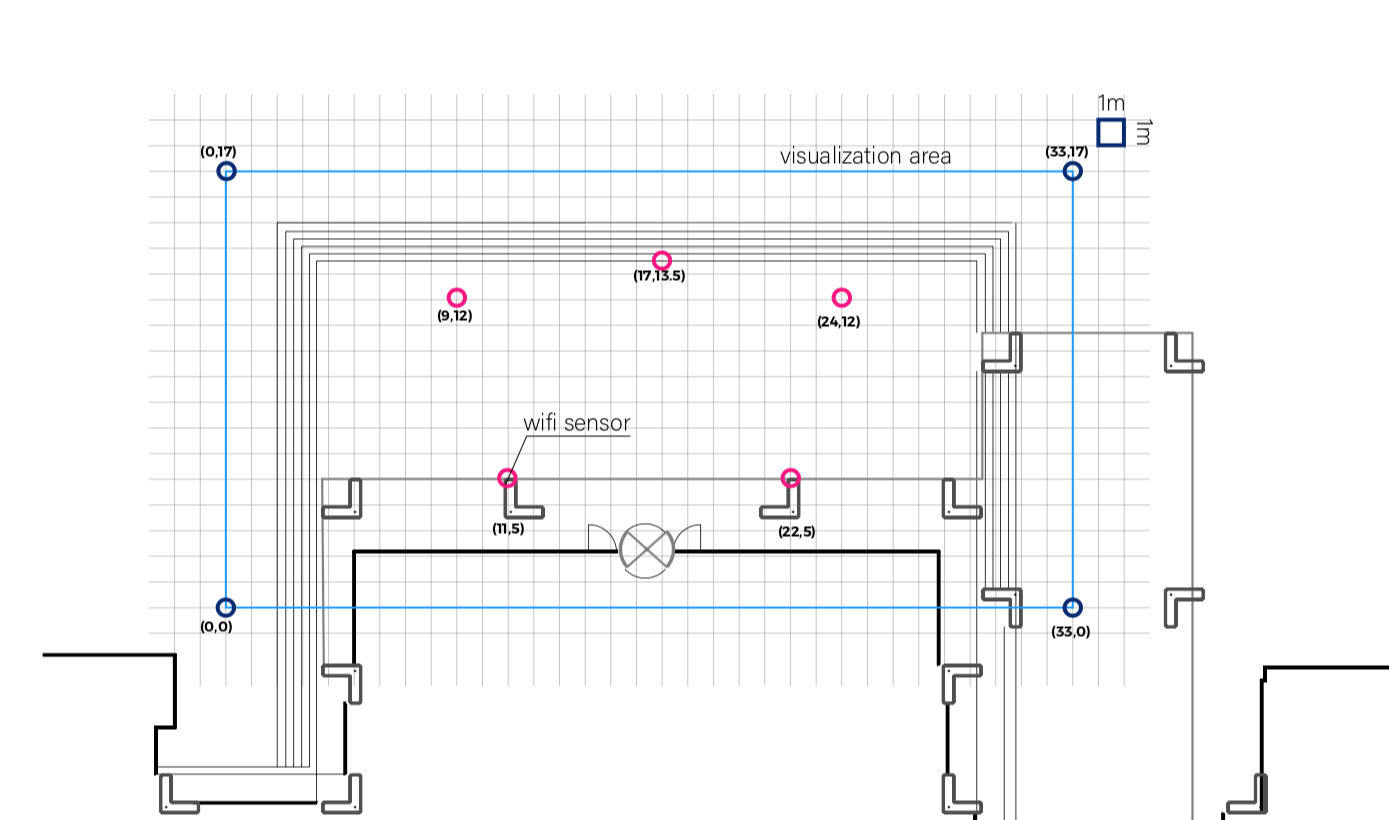
| Sensors |
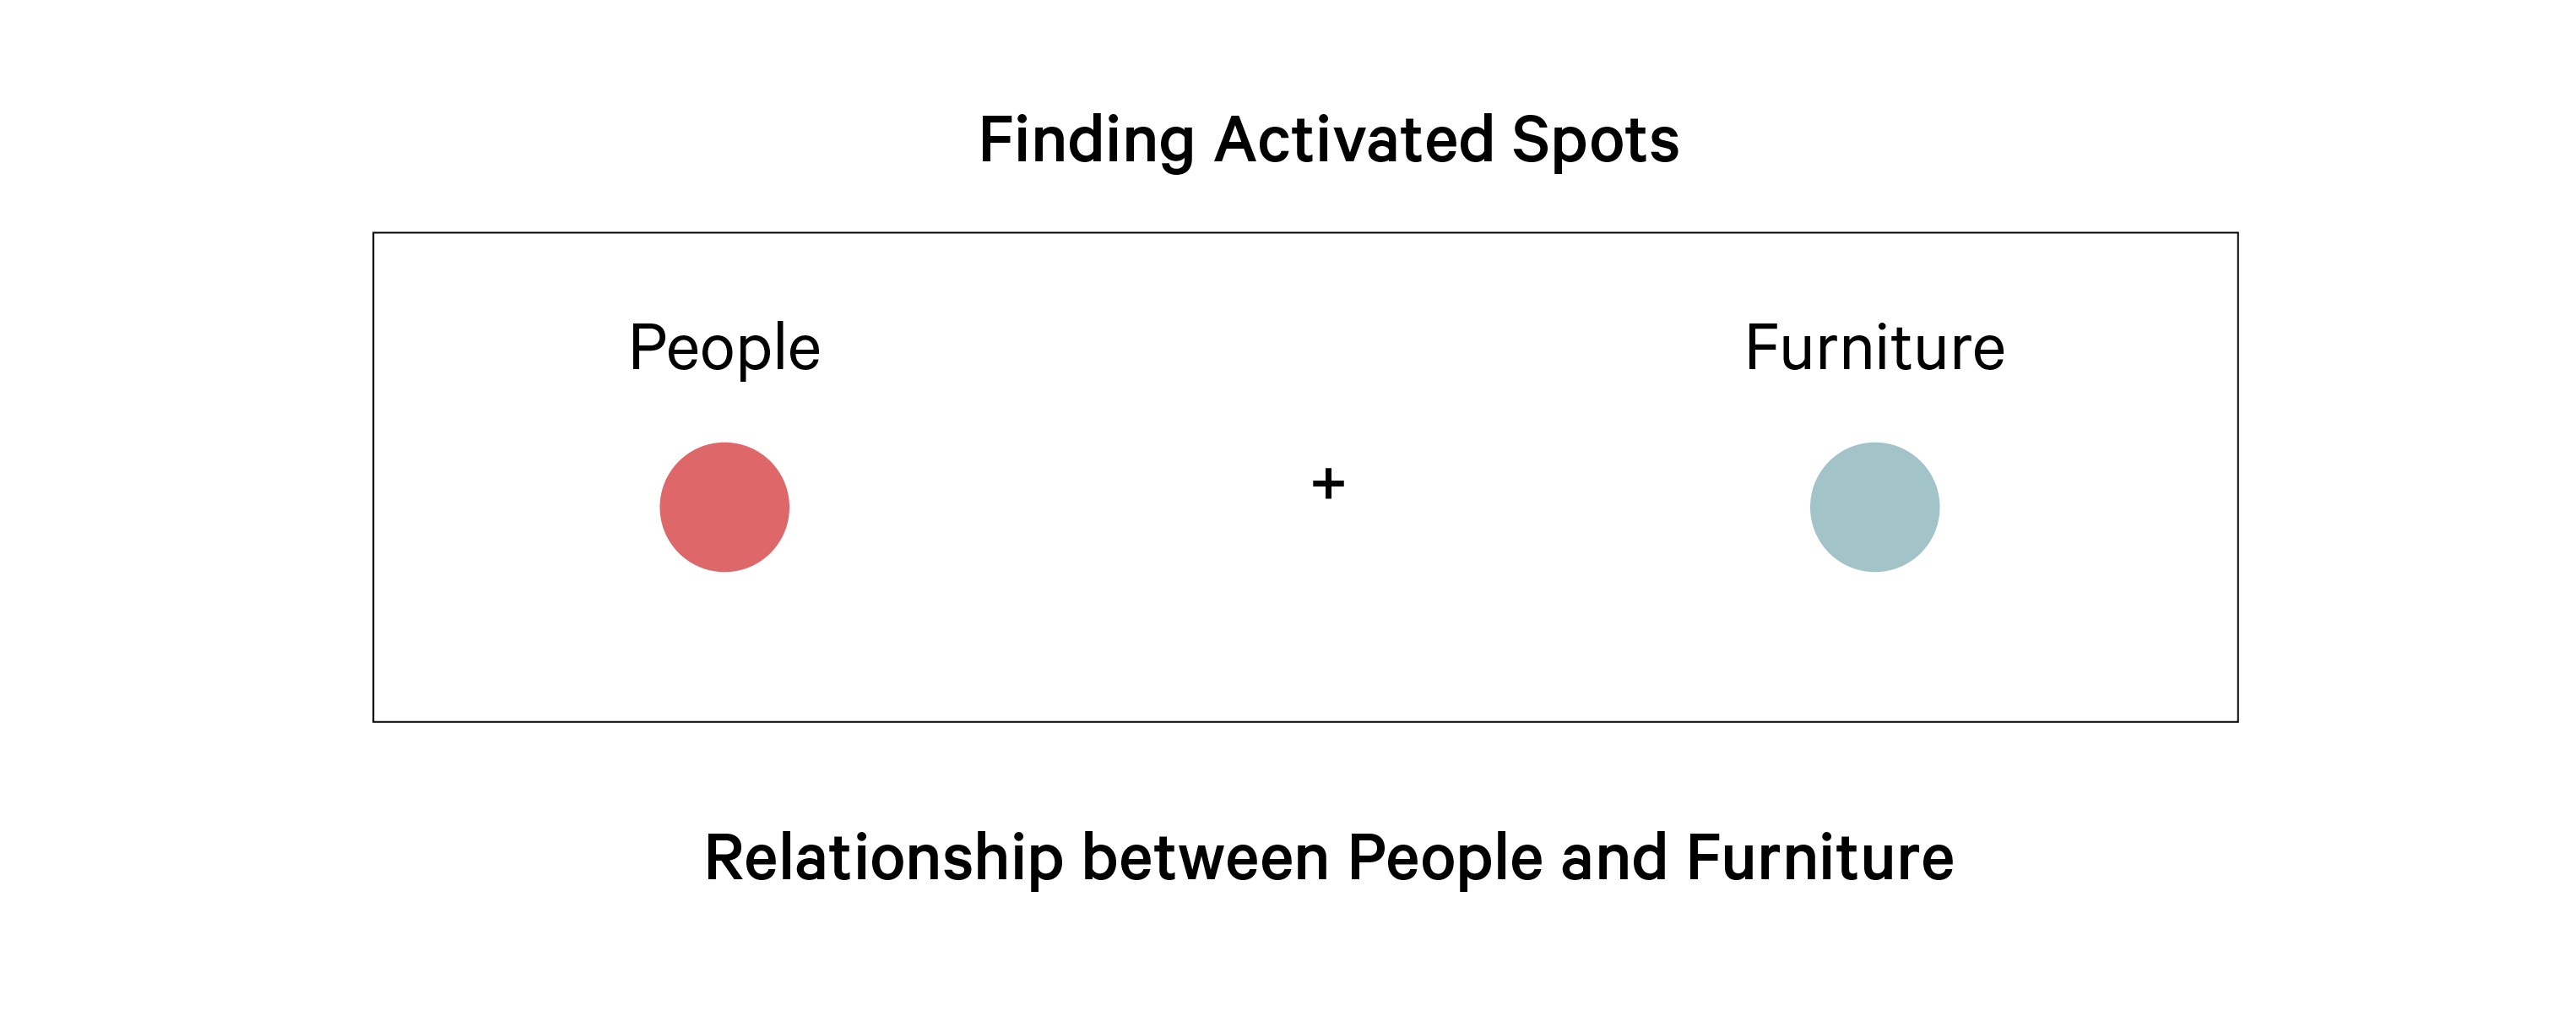
We set the wifi sensors location so that we can calculate and locate the positions of people and furniture based on the same coordinate system.
| Codes |
| Day-to-day Visualization |
The medium was chosen based on the user and their purposes. We had two different types of data visualization for this project, one on a website and the other one on the screen which reflected real time data.

| Real-time Visualization |
The real-time data was visualized in the building’s lobby during the event.
︎ Visit the website for more information