#Data-driven #DataVisualization #Mapping #Emotion #Ambience
Street Life Map
; Adding an emotion layer on the urban area
Harvard Graduate School of Design | 2019
Advisor: David Malan (CS50)
Team: CY Chang, Shikun Zhu
Duration: 1 month
Role: Ideation, research, data collection, implementation
Tools: Mapbox API(JavaScript), Urban Network Analysis(Rhino)
︎ Interactive Prototype
> How might we improve the urban experience for the people who barely know the area?
| Problem |
Visitors, travelers, or newcomers often have a hard time understanding the neighborhood’s ambience just as looking at the maps.
| Goal |
Encouraging people to explore the city and improve their urban experience
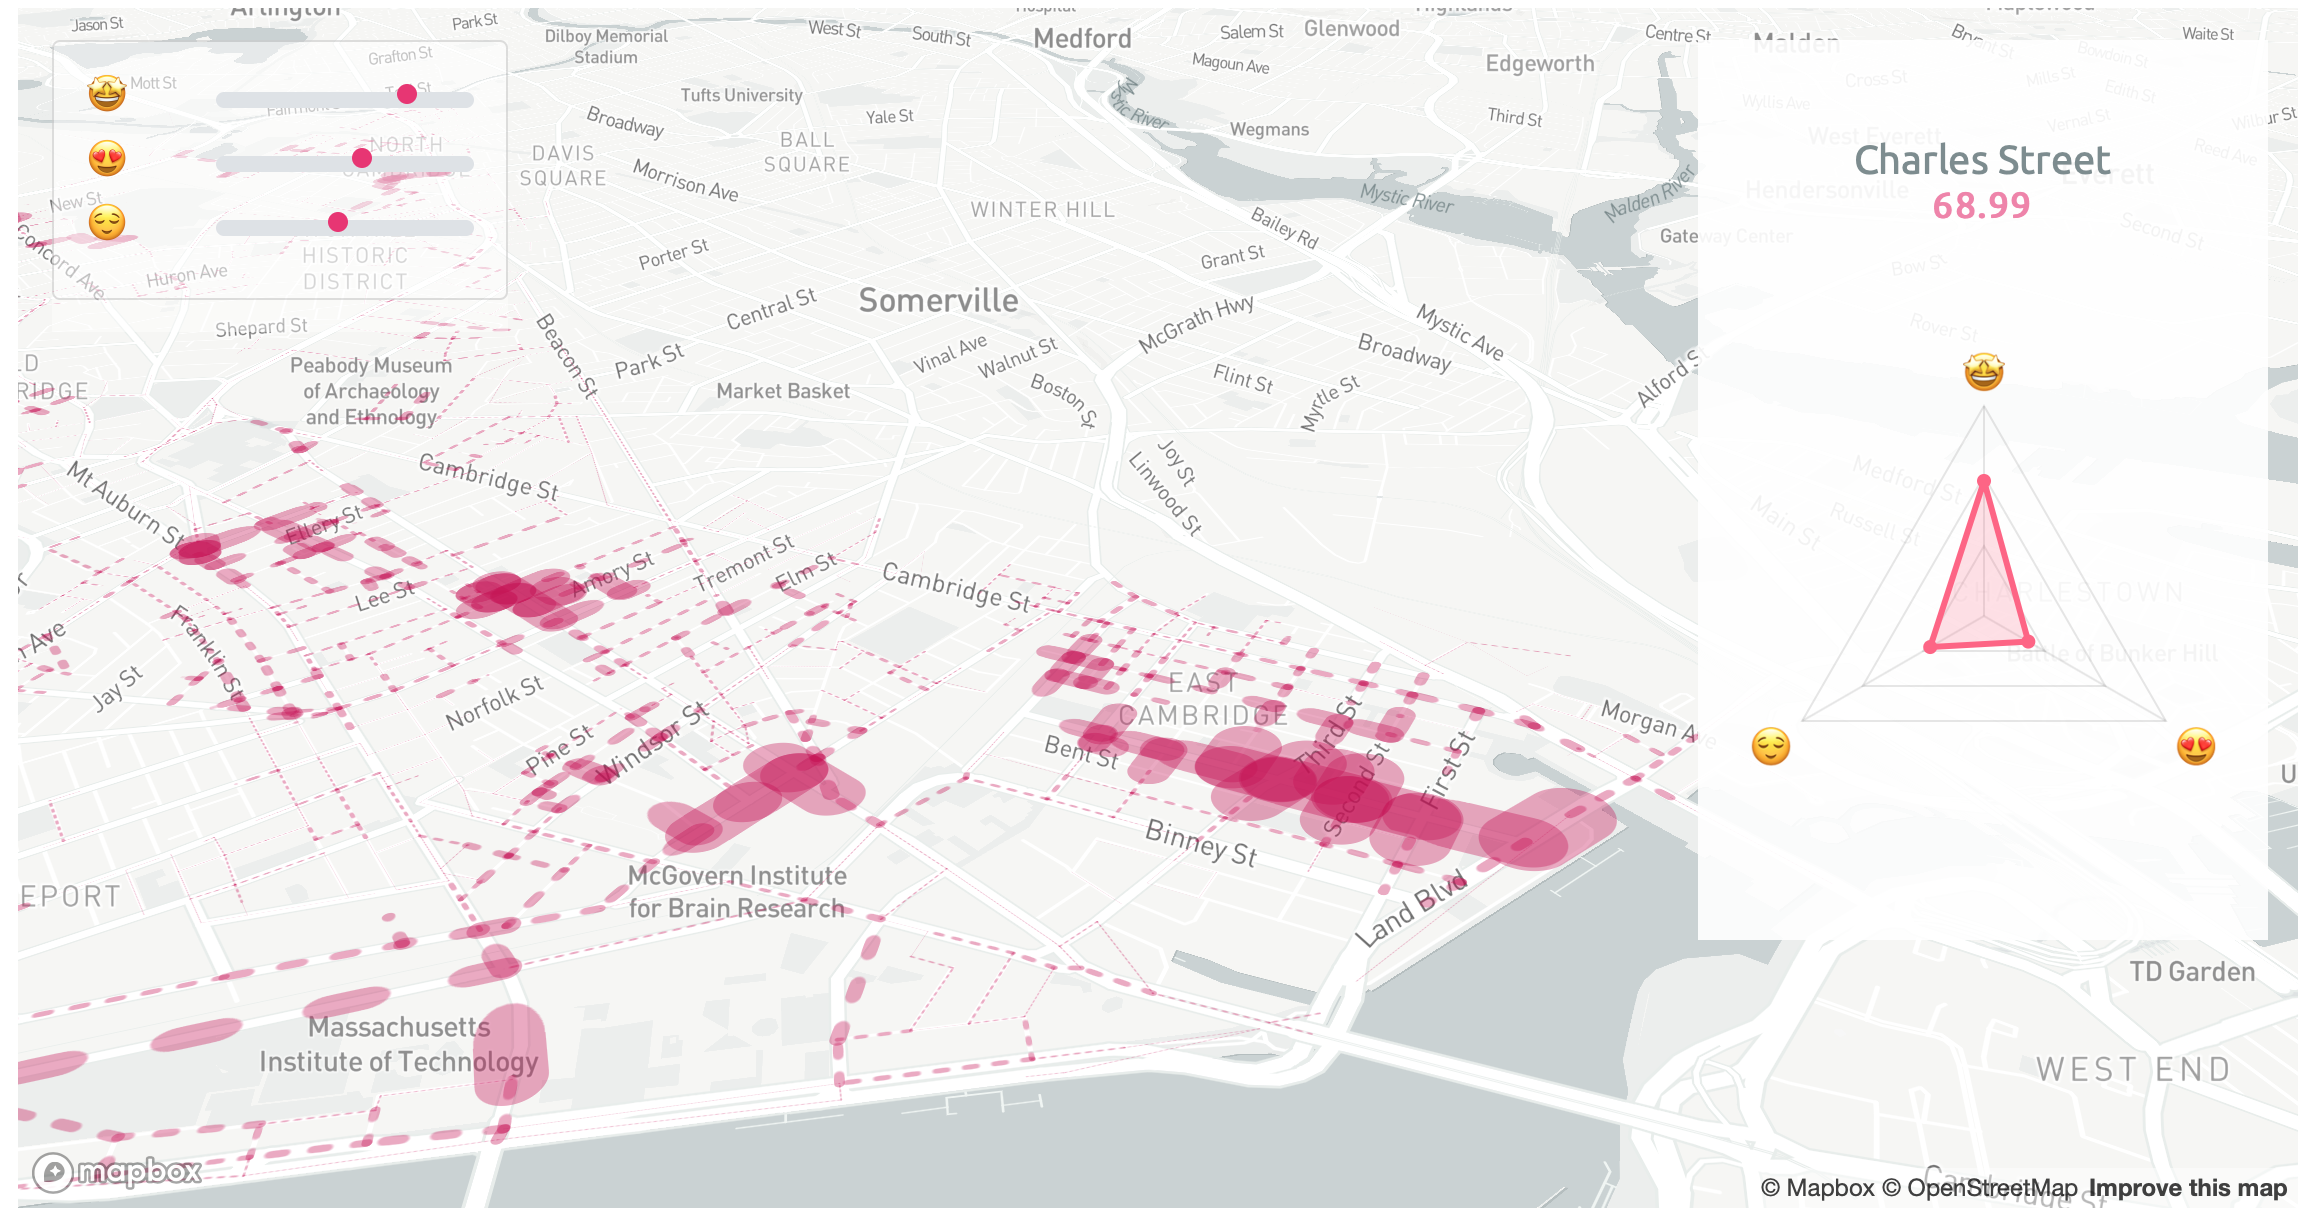
>> A new way of visualizing urban street ambience by measuring the intensity of social activities that may happen on the streets
How it works
| Accessibility to Scores |
The scores are calculated based on certain types of geospatial point (POI) data
e.g., catering, leisure, shop, and tree cover ratio
e.g., catering, leisure, shop, and tree cover ratio
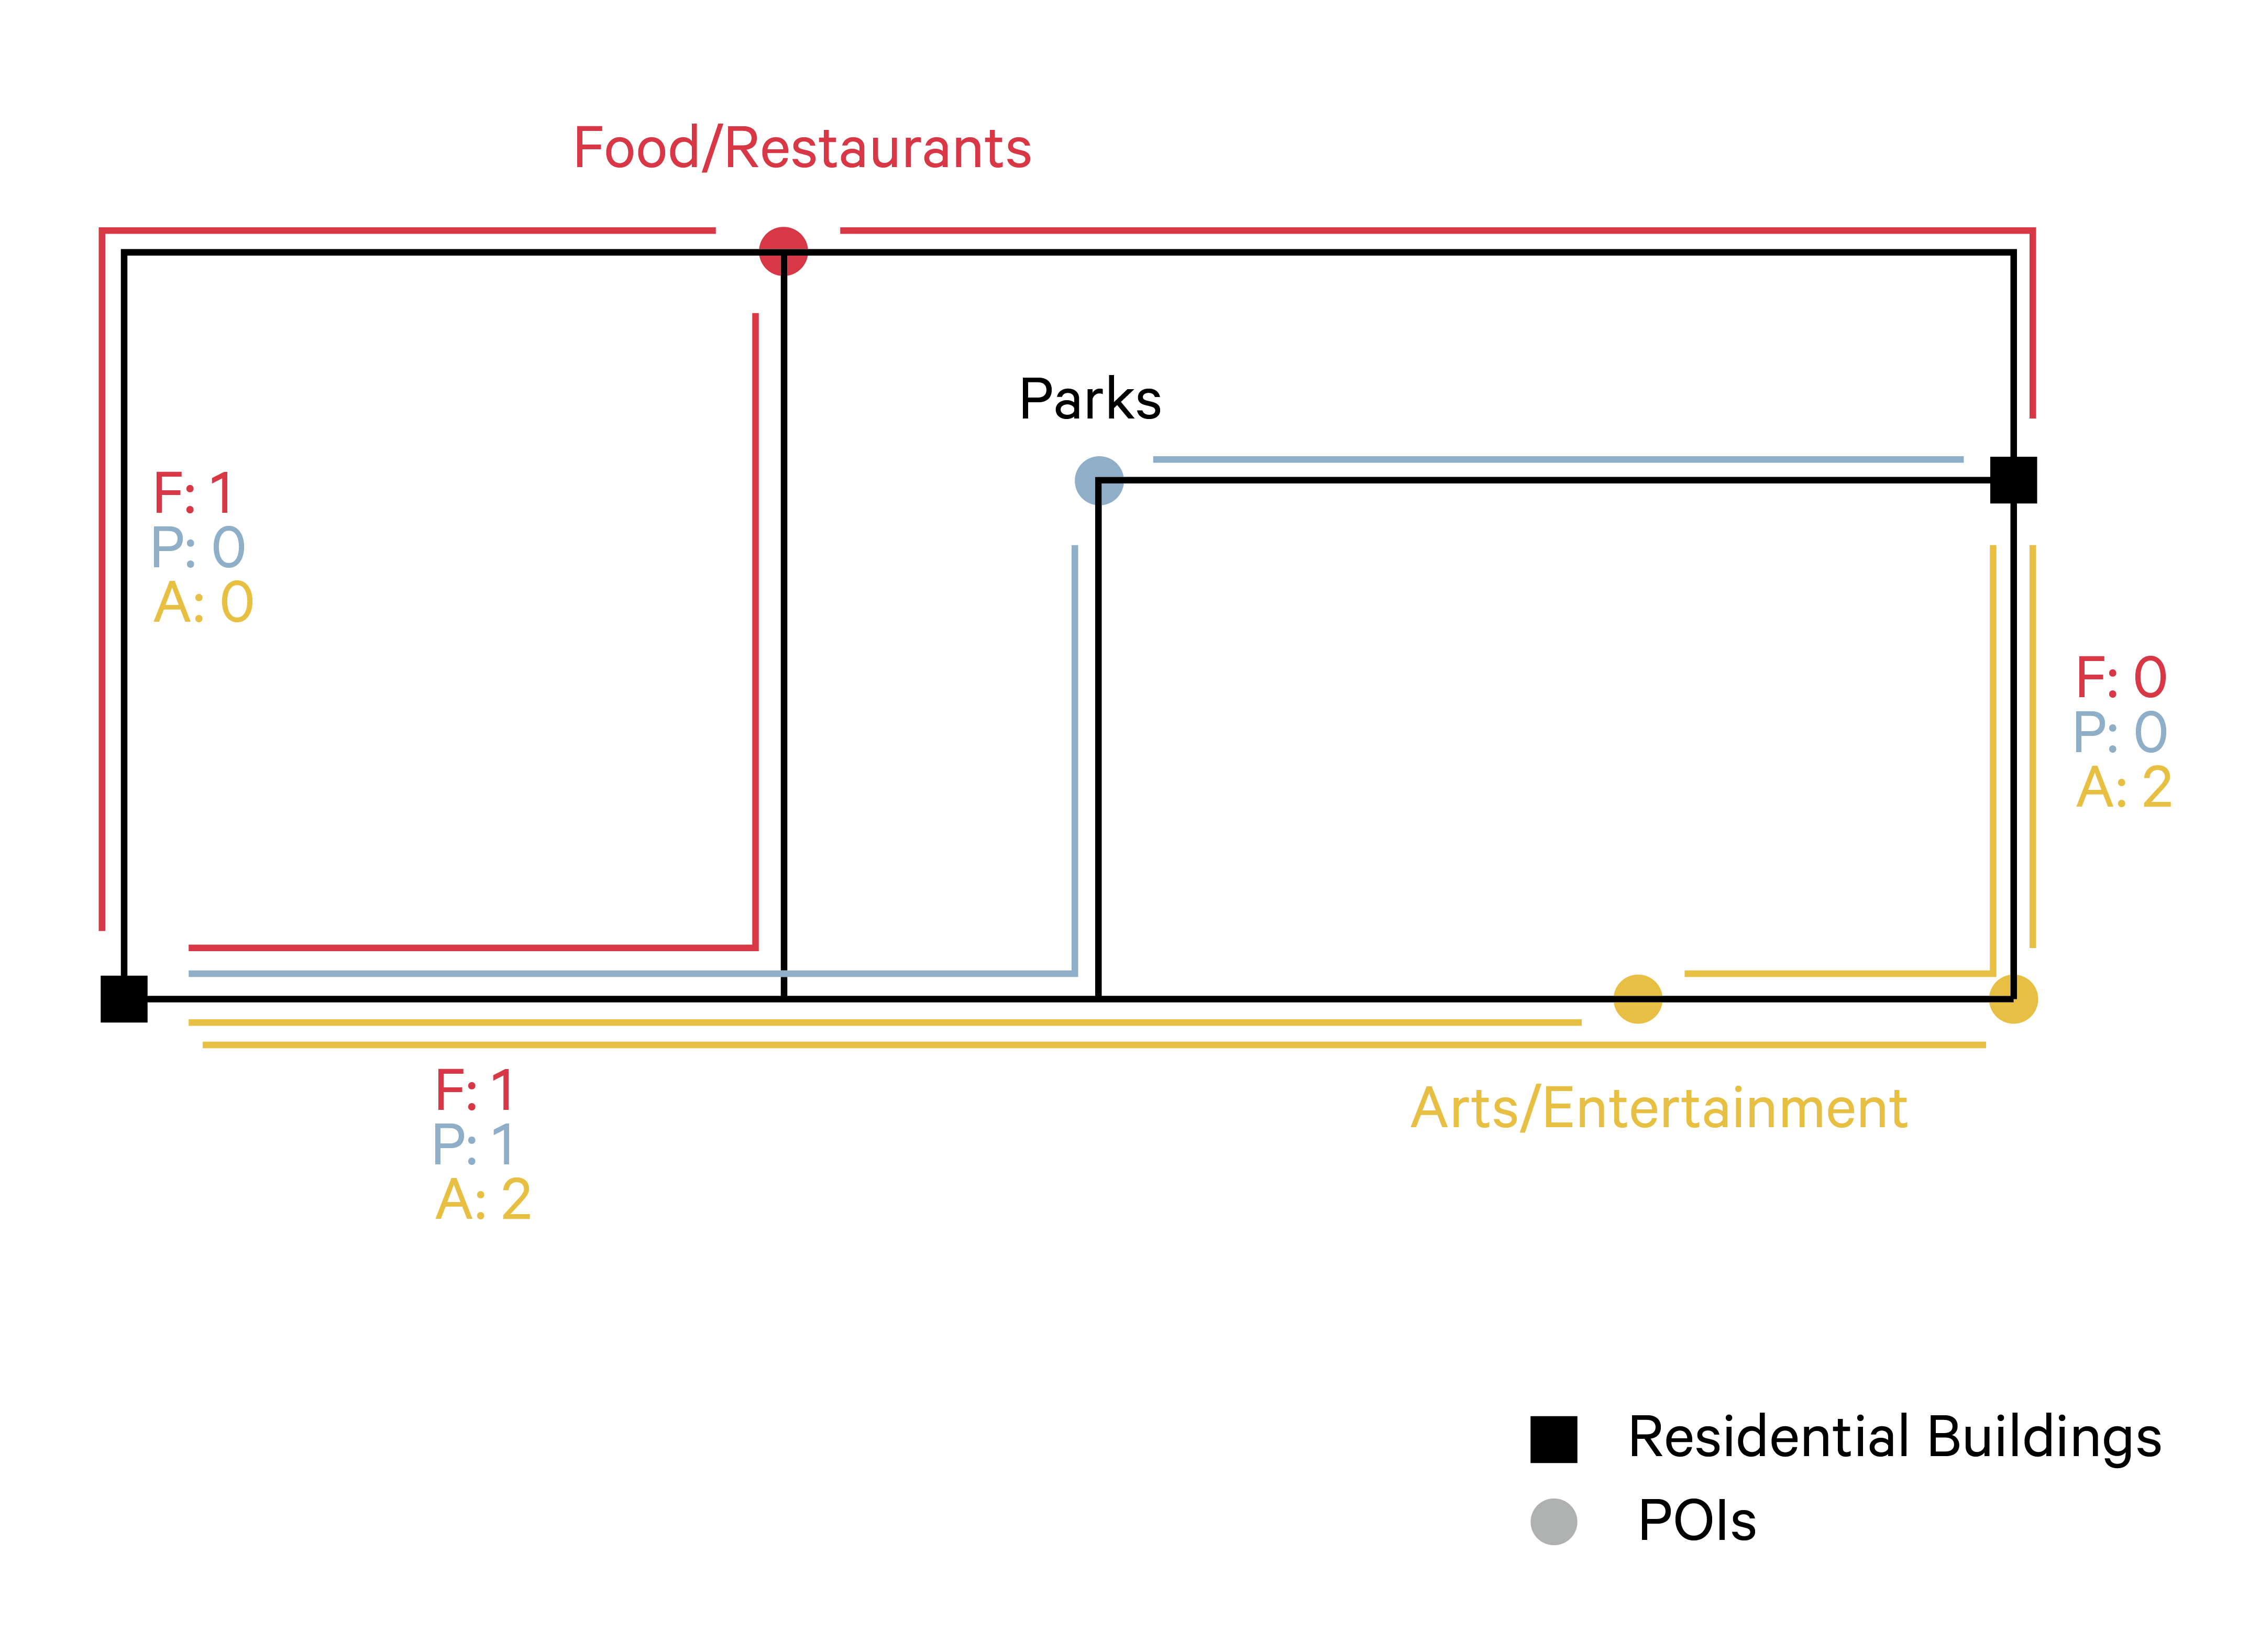
| Scores to Line Weight |
Each street’s scores are normalized and converted to line weights to represent the intensity.

Prototype
︎ Interactive Prototype