#Data-driven #DataVisualization #Mapping #NLP #Emotion
Urban Emotion
; The interrogation of social media and its implications within an urban context
Harvard Graduate School of Design | 2019
Instructor: Jose Luis Garcia del Castillo Lopez
Team: David Rosenwasser
Role: Ideation, research, data collection, NLP, data visualization
Tools: Mapbox API(JavaScript), Python, Watson Tone Analyzer
Data: Instagram posts with geo-location data
Conference Paper published (eCAADe 2020)
![]()
>> Social media as an analytical tool,
helping to transform public policy-making
![]()
Feedback Loop for decision-makers and the public space users
10,000 instagram Boston-geographically-related posts were collected.
![]()
![]()
![]()
Sample data of GeoJSON as a result of emotion analysis
![]()
 L: Highlighting activity by date and visualizing these changes over time.
R: Showcasing a changing visualization of activity during differing blocks of hours during the day.
![]()
![]()
![]() User demonstrations and activity from exhibition
User demonstrations and activity from exhibition
︎︎︎ Go Back
Urban Emotion
; The interrogation of social media and its implications within an urban contextHarvard Graduate School of Design | 2019
Instructor: Jose Luis Garcia del Castillo Lopez
Team: David Rosenwasser
Role: Ideation, research, data collection, NLP, data visualization
Tools: Mapbox API(JavaScript), Python, Watson Tone Analyzer
Data: Instagram posts with geo-location data
Conference Paper published (eCAADe 2020)
> How might we analyze how citizens perceive the public spaces?
| Problem |
Designers and planners find it challenging to constantly connect with their users and receive feedback from the spaces they created.
| Goal |
1) Help decision-makers and designers easily understand how public spaces are utilized and perceived by users.
2) Create a feedback loop that decision-makers find whether the places are utilized as they intended.
>> Social media as an analytical tool,
helping to transform public policy-making
by detecting emotions using Natural Language Processing
How it works
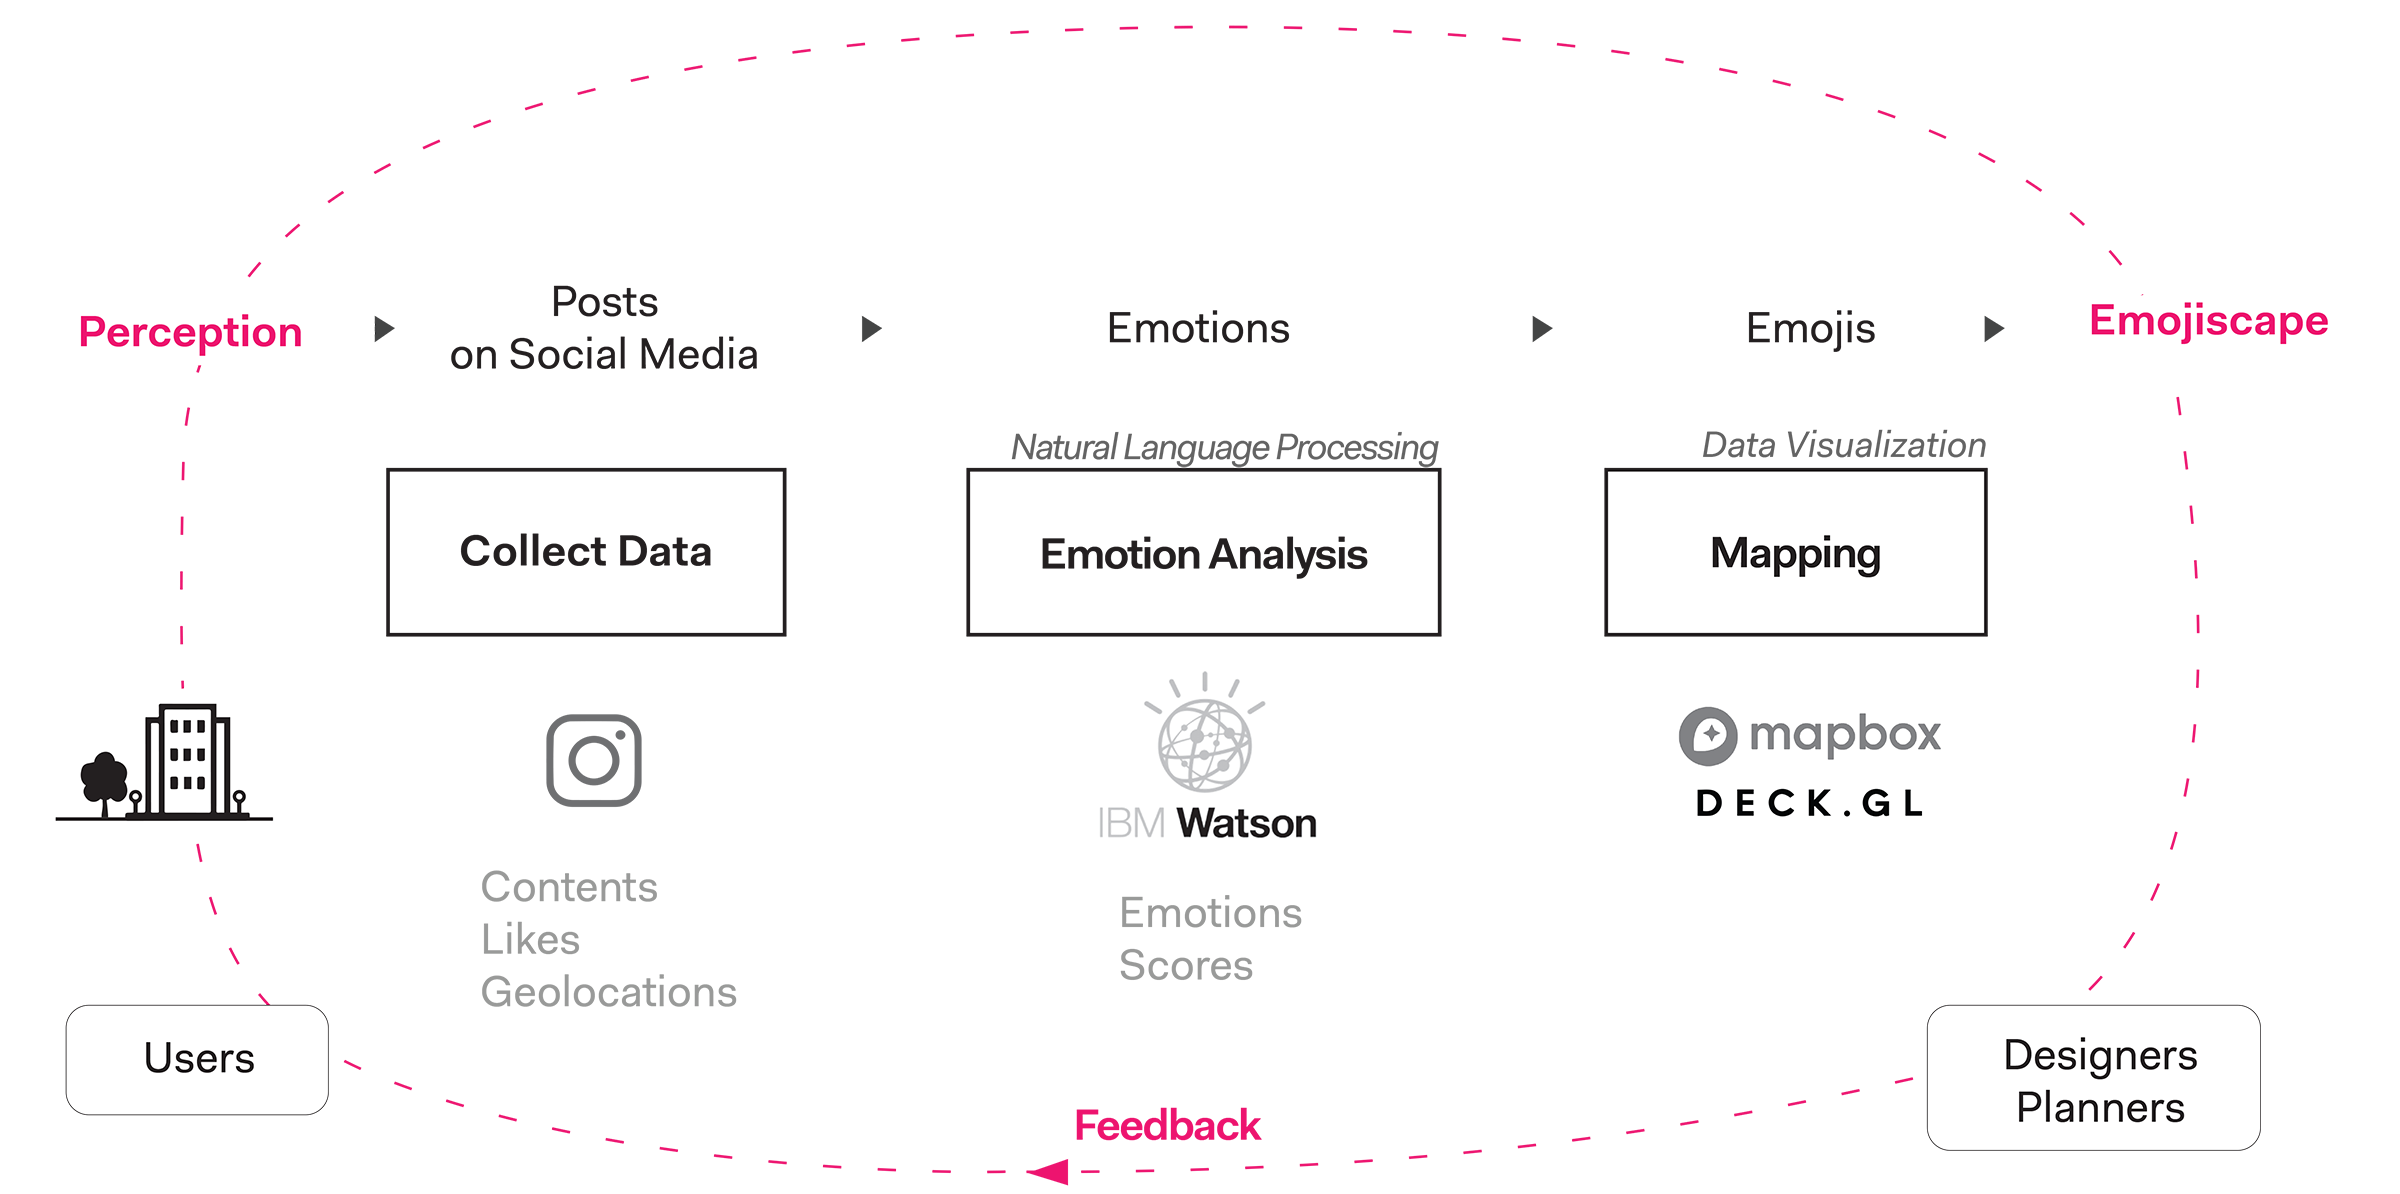
Feedback Loop for decision-makers and the public space users
| Data Collection |
10,000 instagram Boston-geographically-related posts were collected.
- Posts contained a geotagged location.
- Data was derived from the 1000 most posted about locations in order to limit the scope to places that had larger numbers of posts for the analysis.
- The search filtered out posts with the locations “Boston, Massachusetts,” “Cambridge,” “South Boston,” and “East Boston” due to the broad nature of these locations.
- All posts were geotagged within a 2 mile radius of coordinate 42.361139, -71.058254, the centermost part of Boston, where Boston City Hall is located.
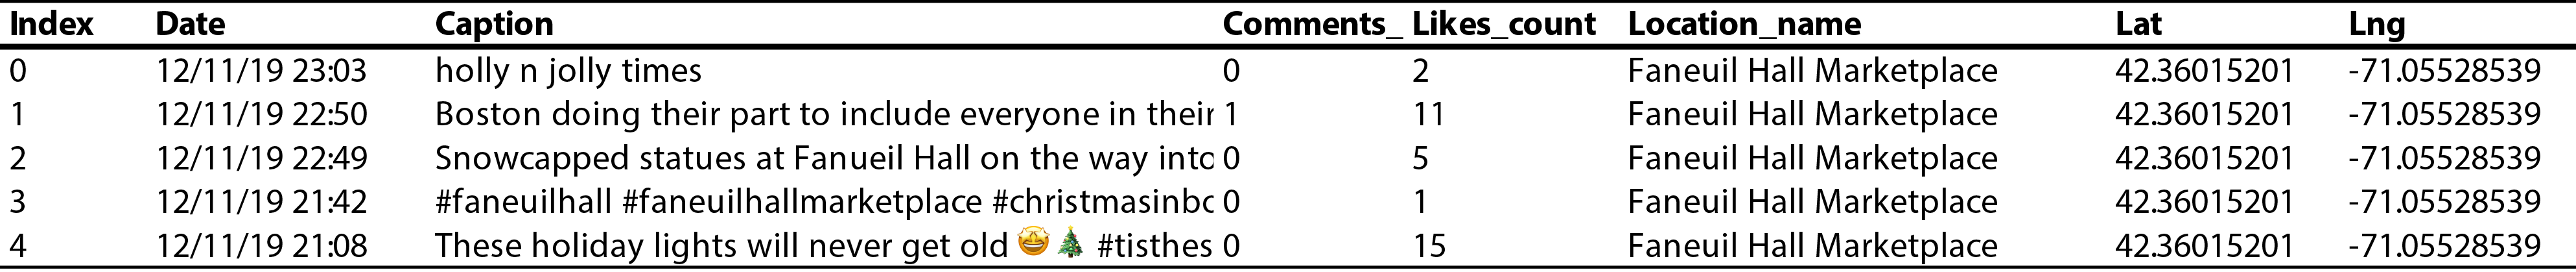
Example of data found within CSV file. Each instagram post is broken down by row
| Natural Language Processing |
The emotion and score of each post was extracted from its content, using IBM Watson Tone Analyzer API.
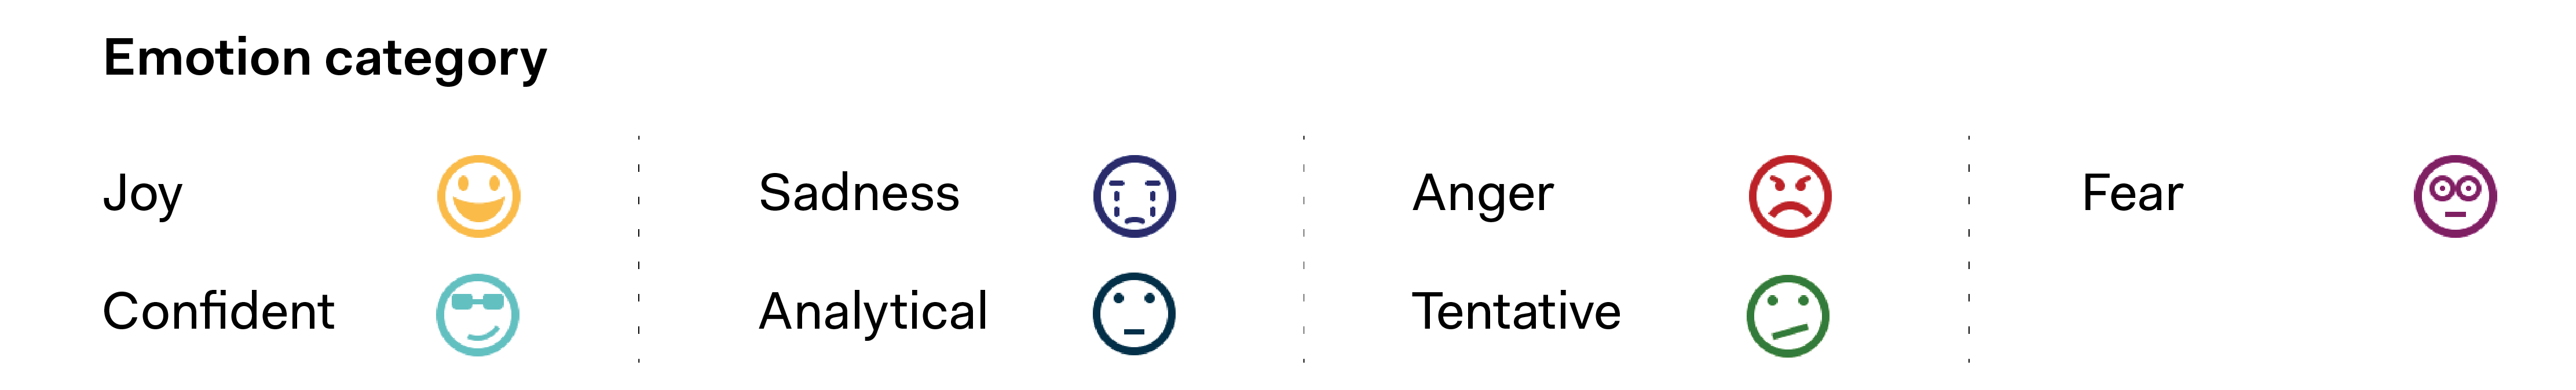
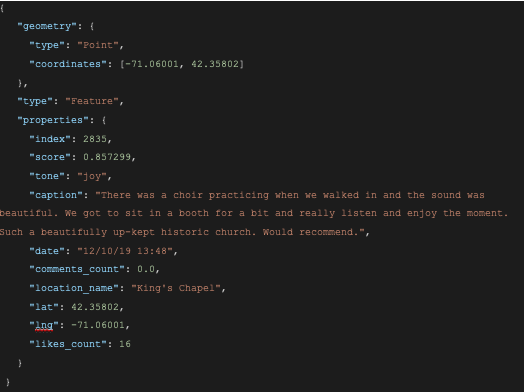
Sample data of GeoJSON as a result of emotion analysis
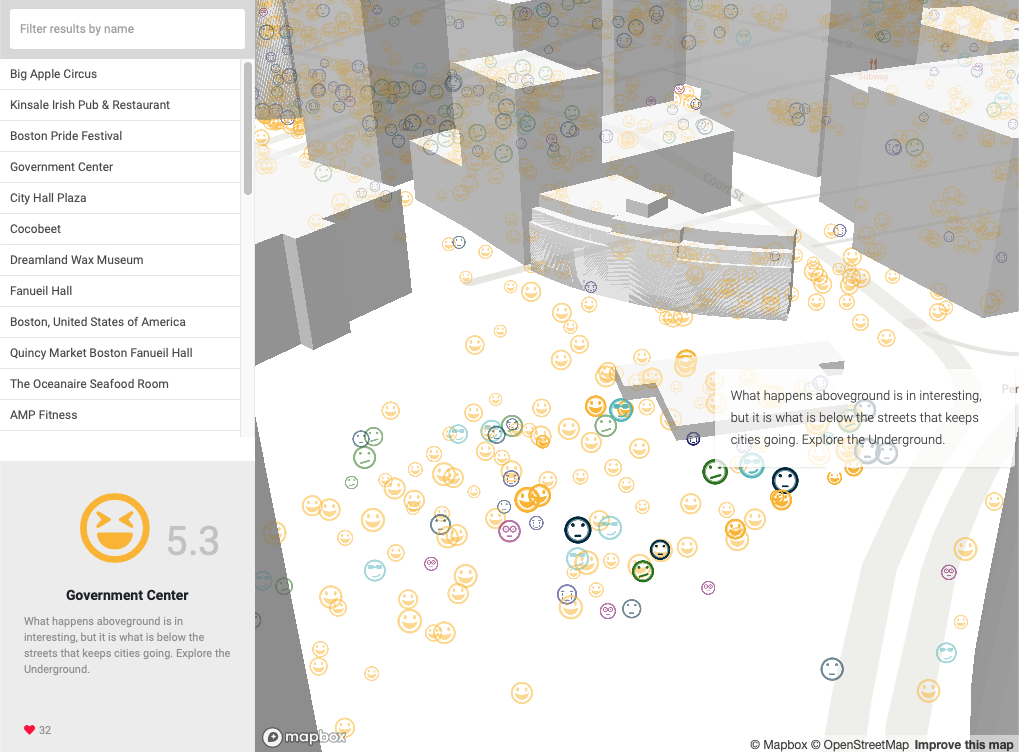
Prototype
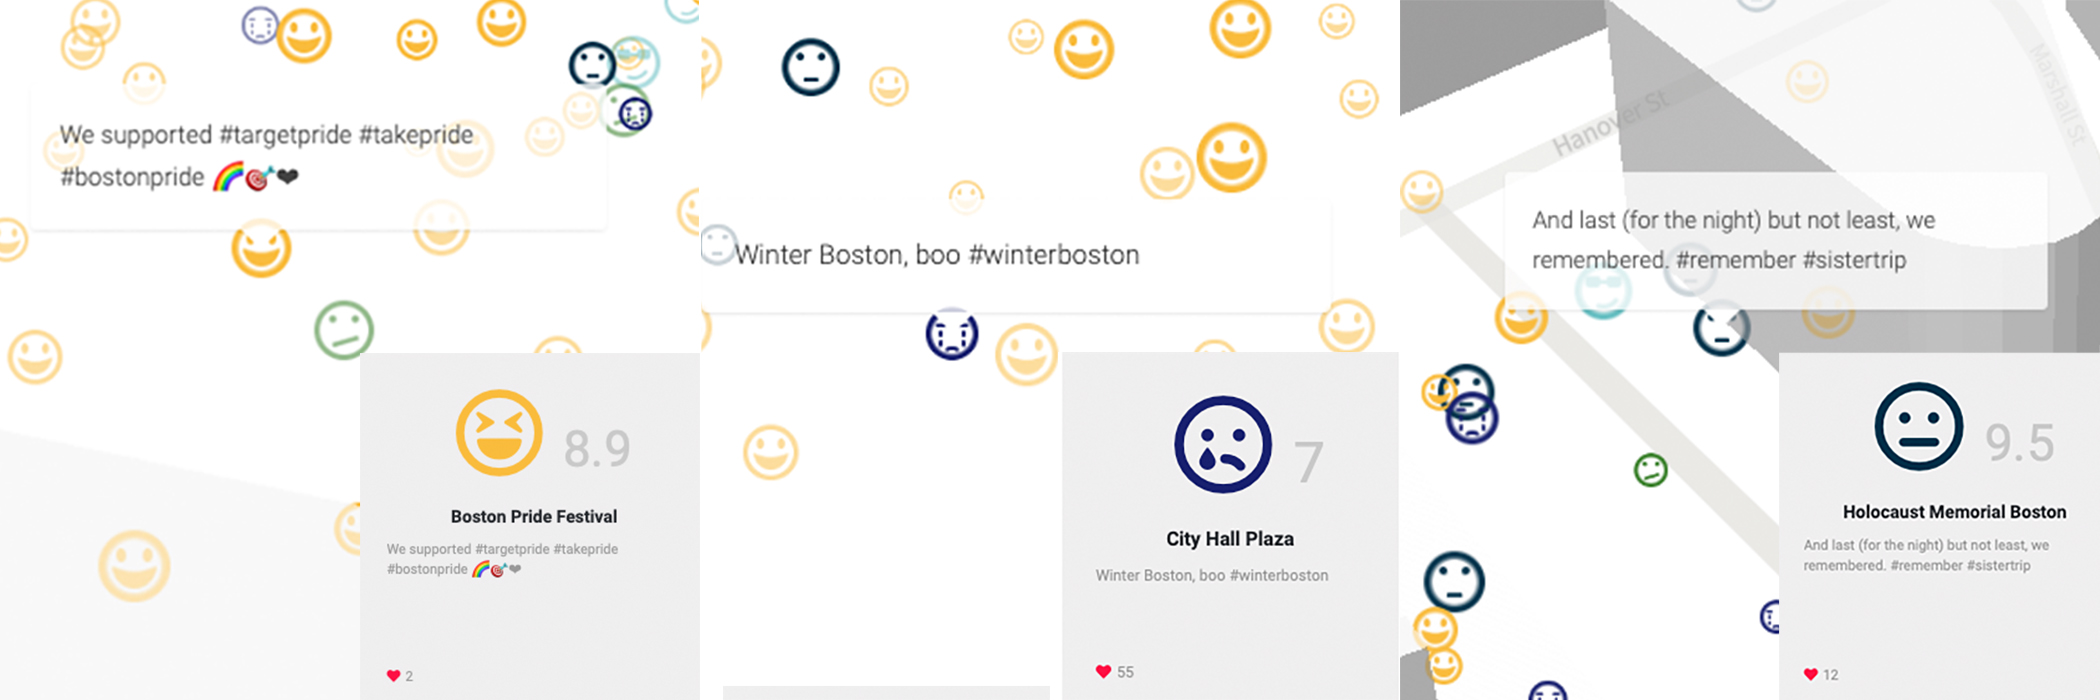
| EmojiScape |
Qualitative representation of the inhabitants’ perception of the urban fabric
![]()
| TrendScape |
Temporal dimension of emotions and the understanding of their evolving quality
| TrendScape |
Temporal dimension of emotions and the understanding of their evolving quality
 L: Highlighting activity by date and visualizing these changes over time.
R: Showcasing a changing visualization of activity during differing blocks of hours during the day.
Exhibition

 User demonstrations and activity from exhibition
︎︎︎ Go Back