#Data-driven #DataVisualization
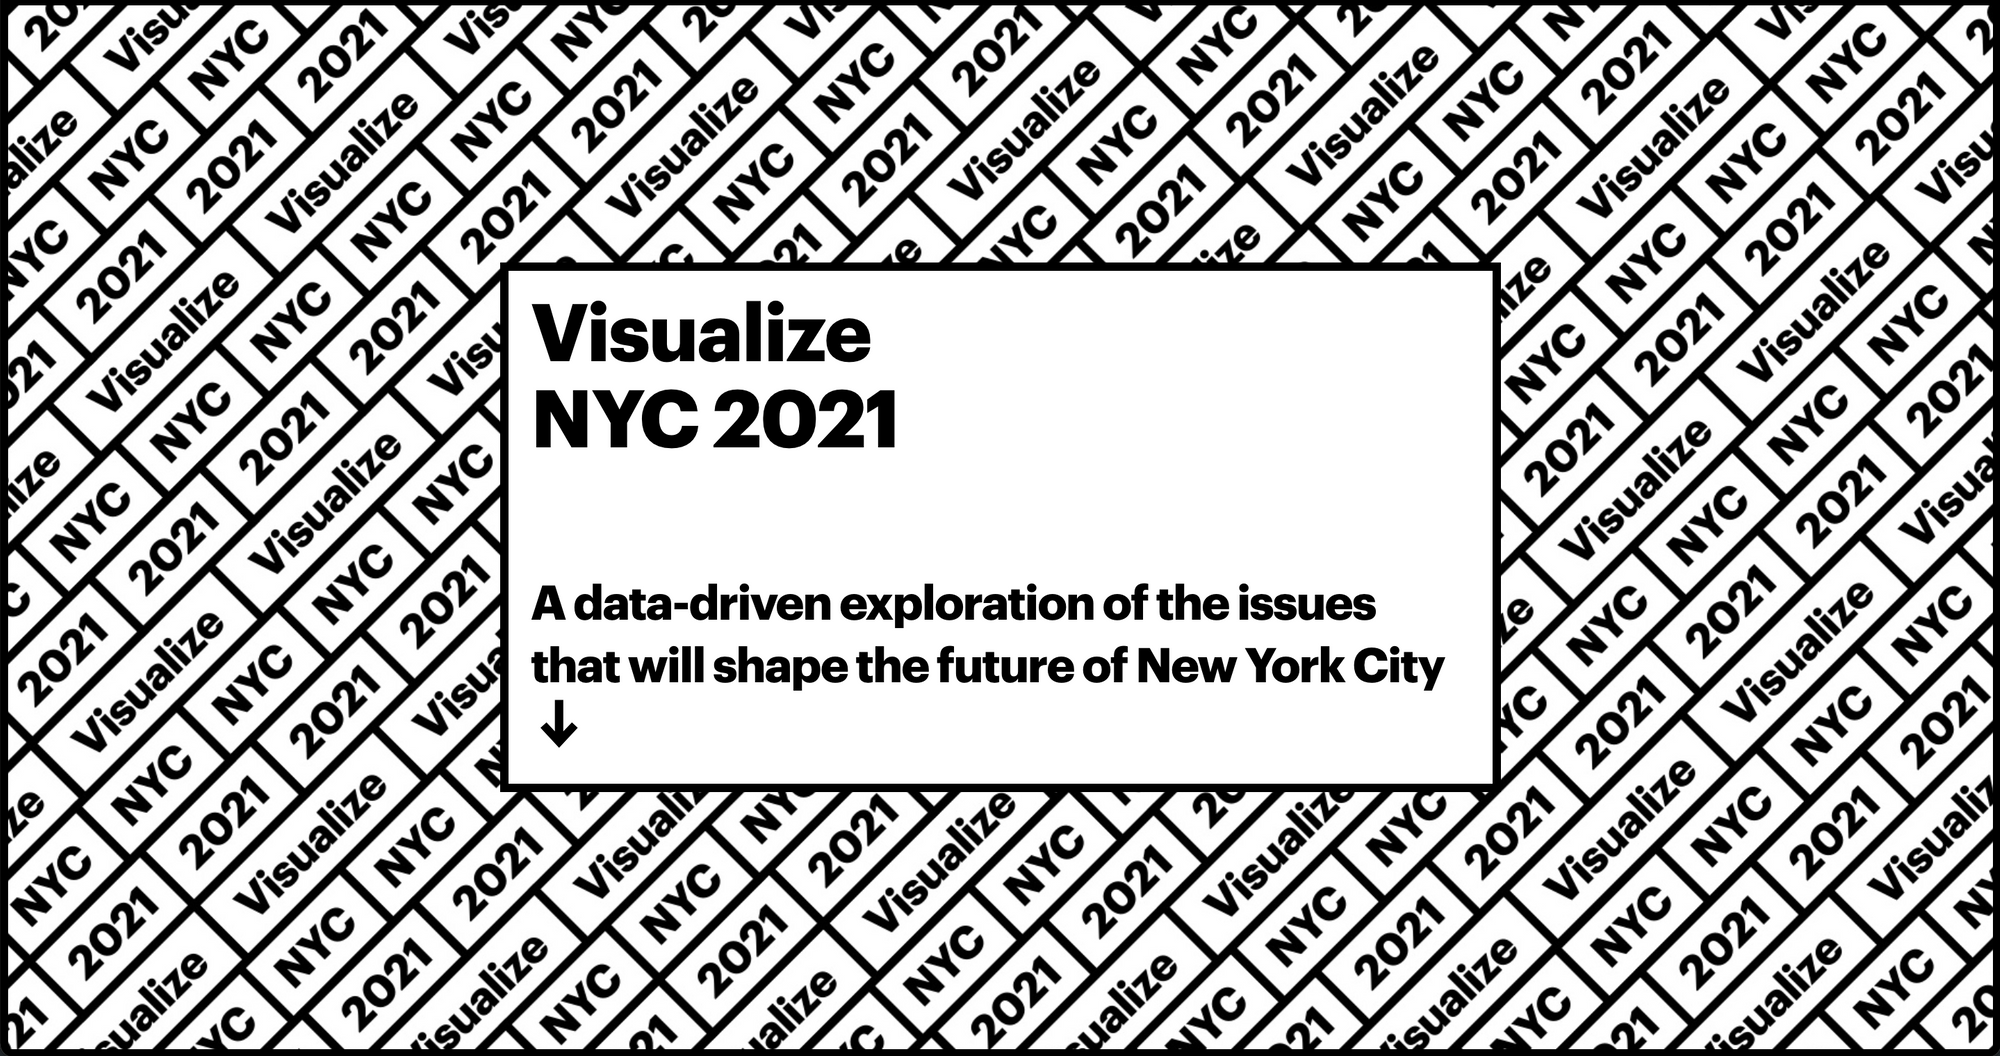
Visualize NYC 2021
; A data-driven exploration of the issues that will shape the future of New York City
MIT Civic Data Design Lab | 2020
Role: Project Management, Website Design (Add your voice), Data visualization(What’s at stake?)
Tools: D3.js
In collaboration with AIA New York and the Center for Architecture, “Visualize NYC 2021” is a virtual exhibition responding to the historic opportunity for change leading up to New York City’s 2021 elections.
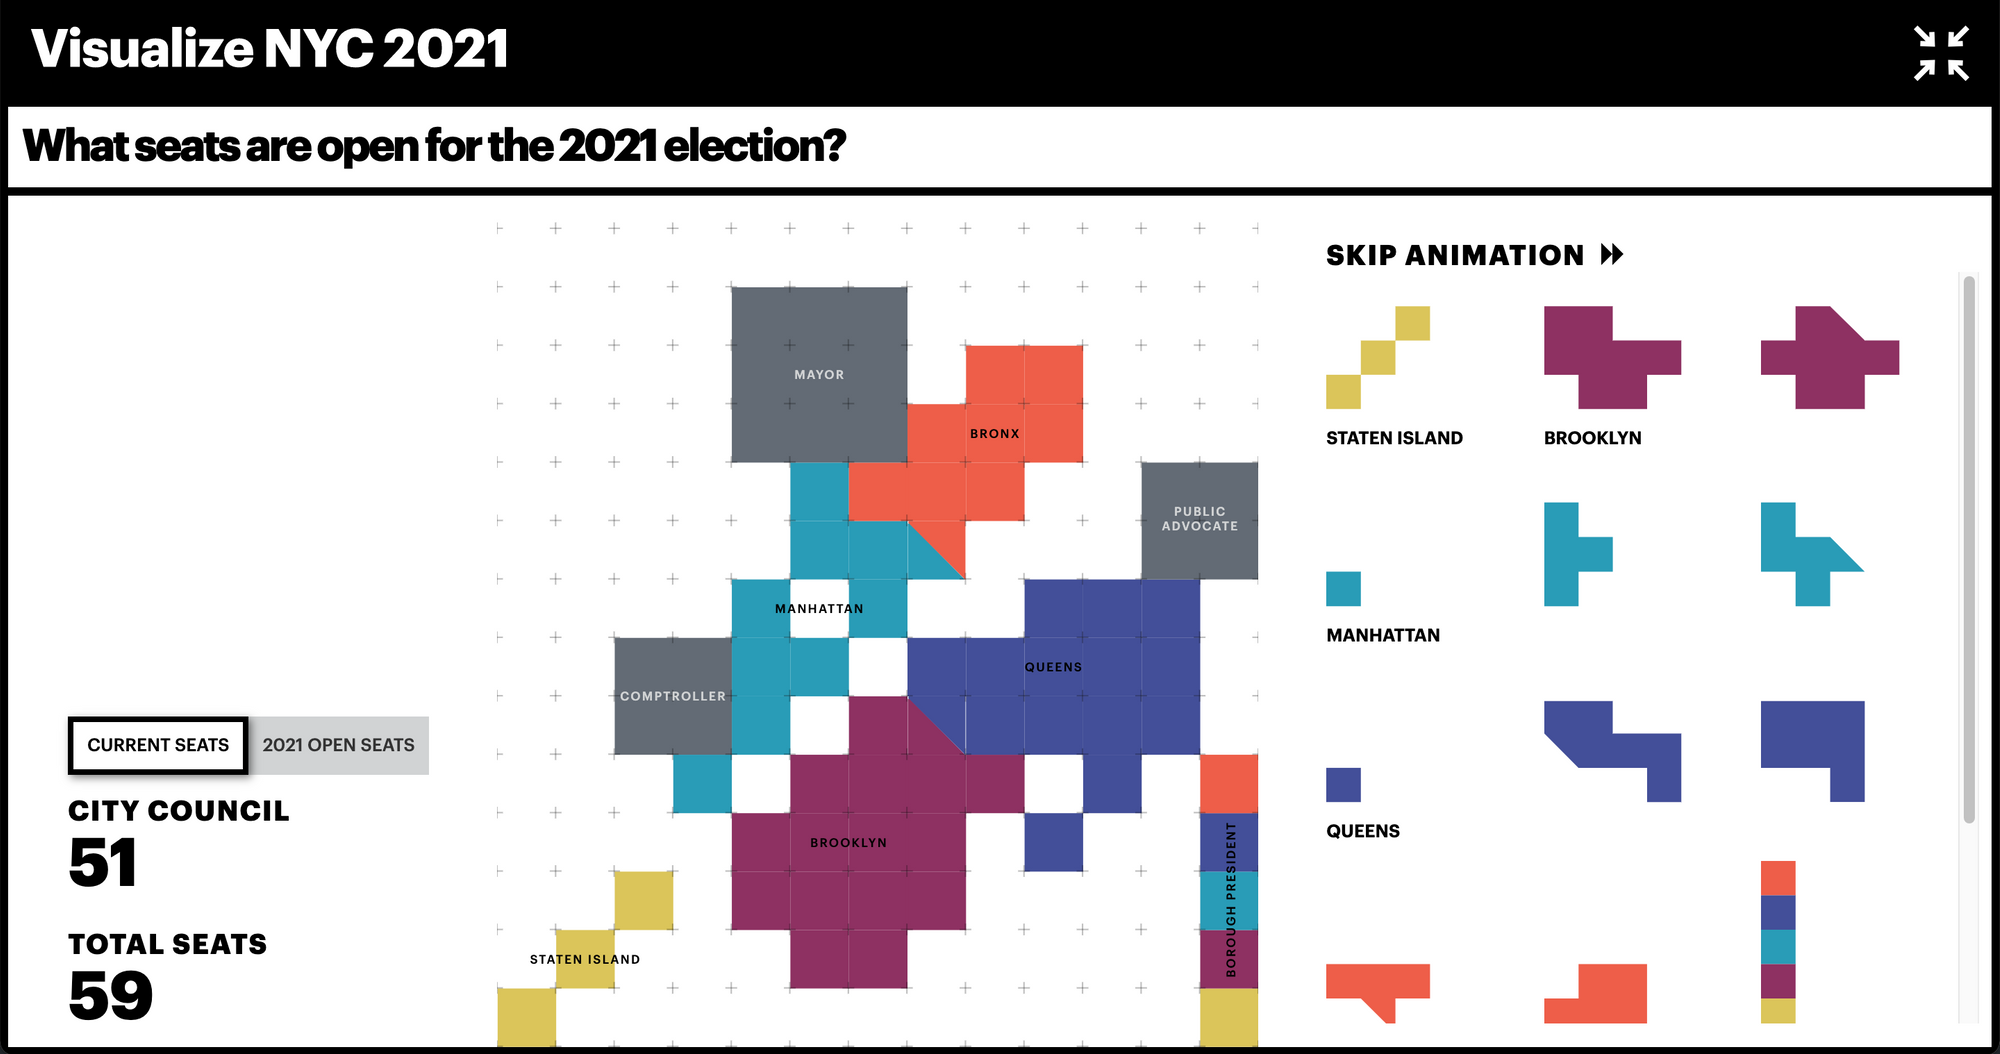
The coronavirus pandemic has laid bare the City’s existing social inequities and limitations, opening up conversations about how we might envision a better New York City for all. In parallel, the local elections in November 2021 will see an unprecedented amount of turnover. In addition to the mayor, 41 elected officials will reach term limits, including four borough presidents and up to 35 City Council members and the comptroller. The number of open positions creates a singular opportunity for change in the five boroughs, and the incoming civic leaders will have the potential to remake the political landscape.
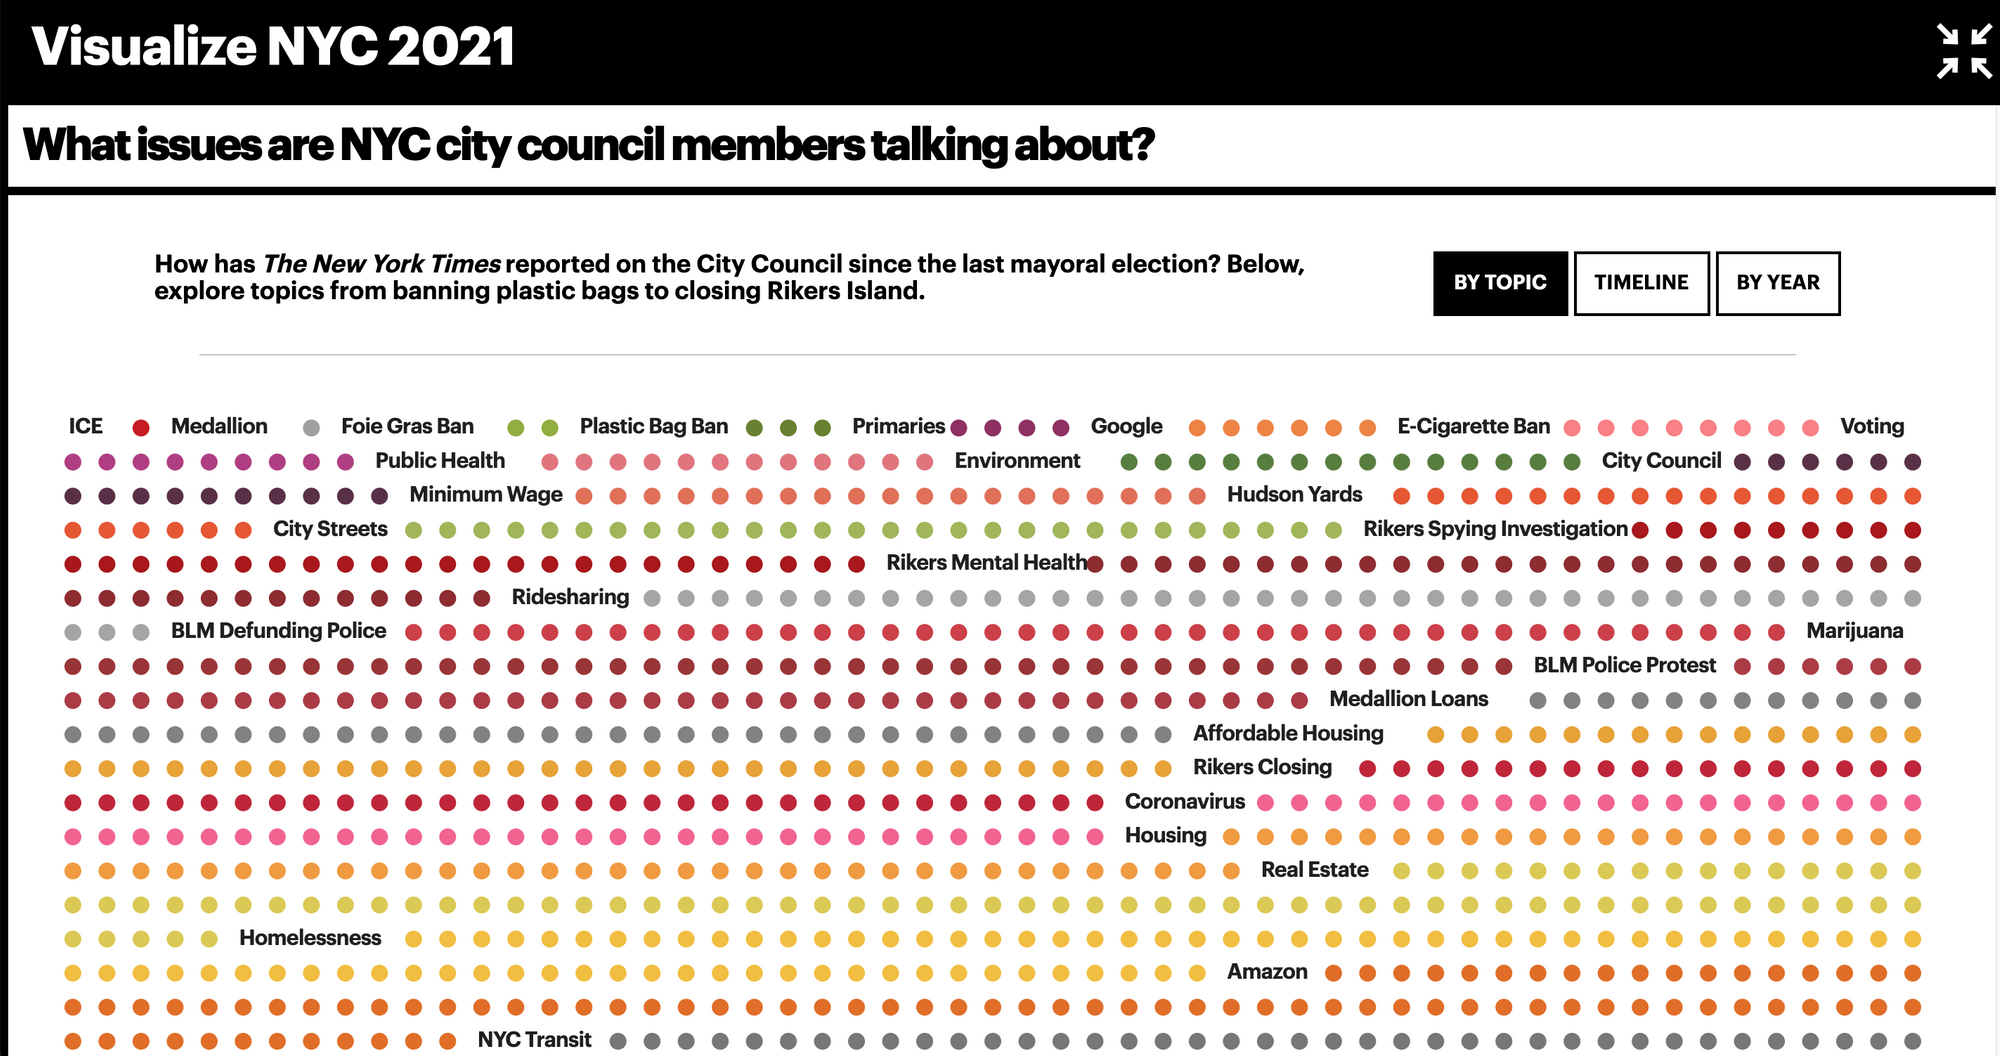
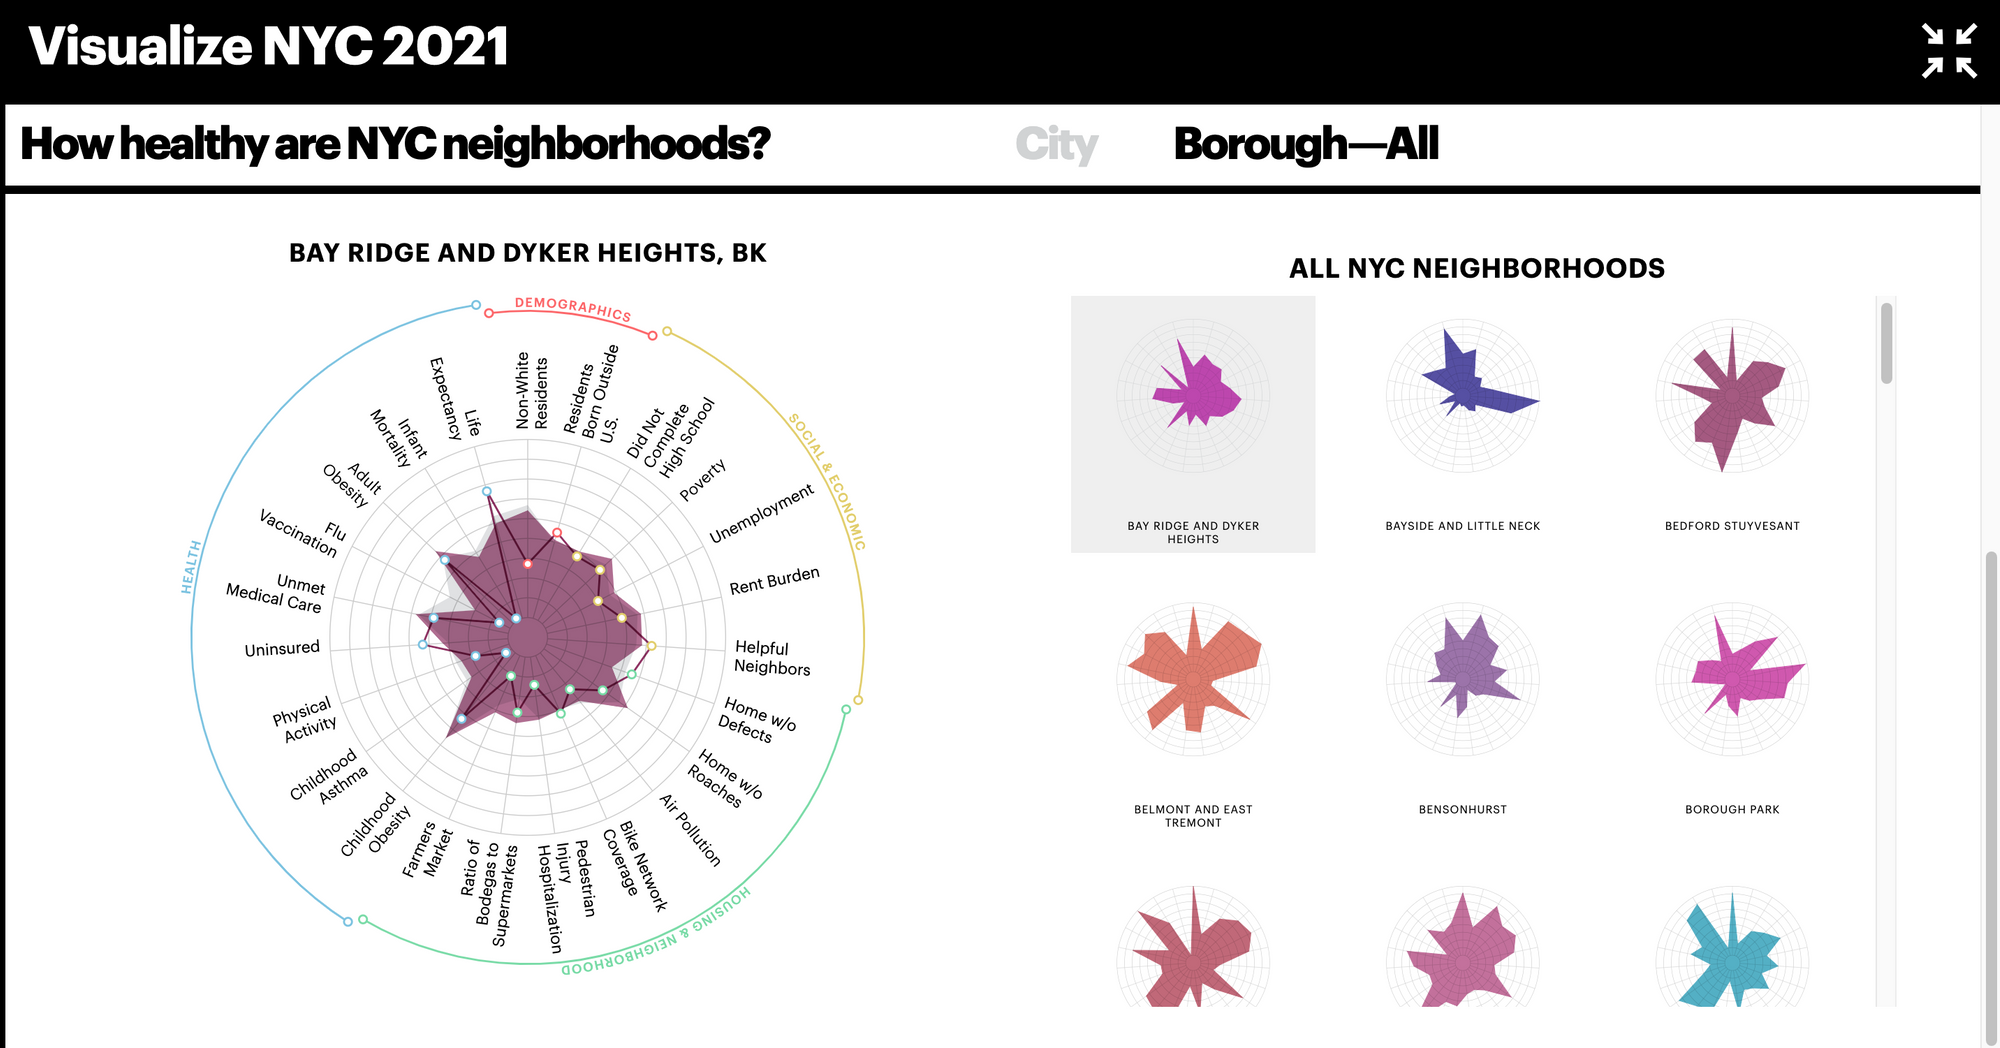
The Civic Data Design Lab was asked to help curate the exhibition and explore how data can illuminate the tensions and opportunities in issues that will be central in the 2021 local elections. Students in the Spring 2020 course, “Big Data, Visualization, and Society” worked on data visualizations across five key topic areas: climate change; housing; public realm and our streets; and neighborhood health -- all with a lense towards equity.
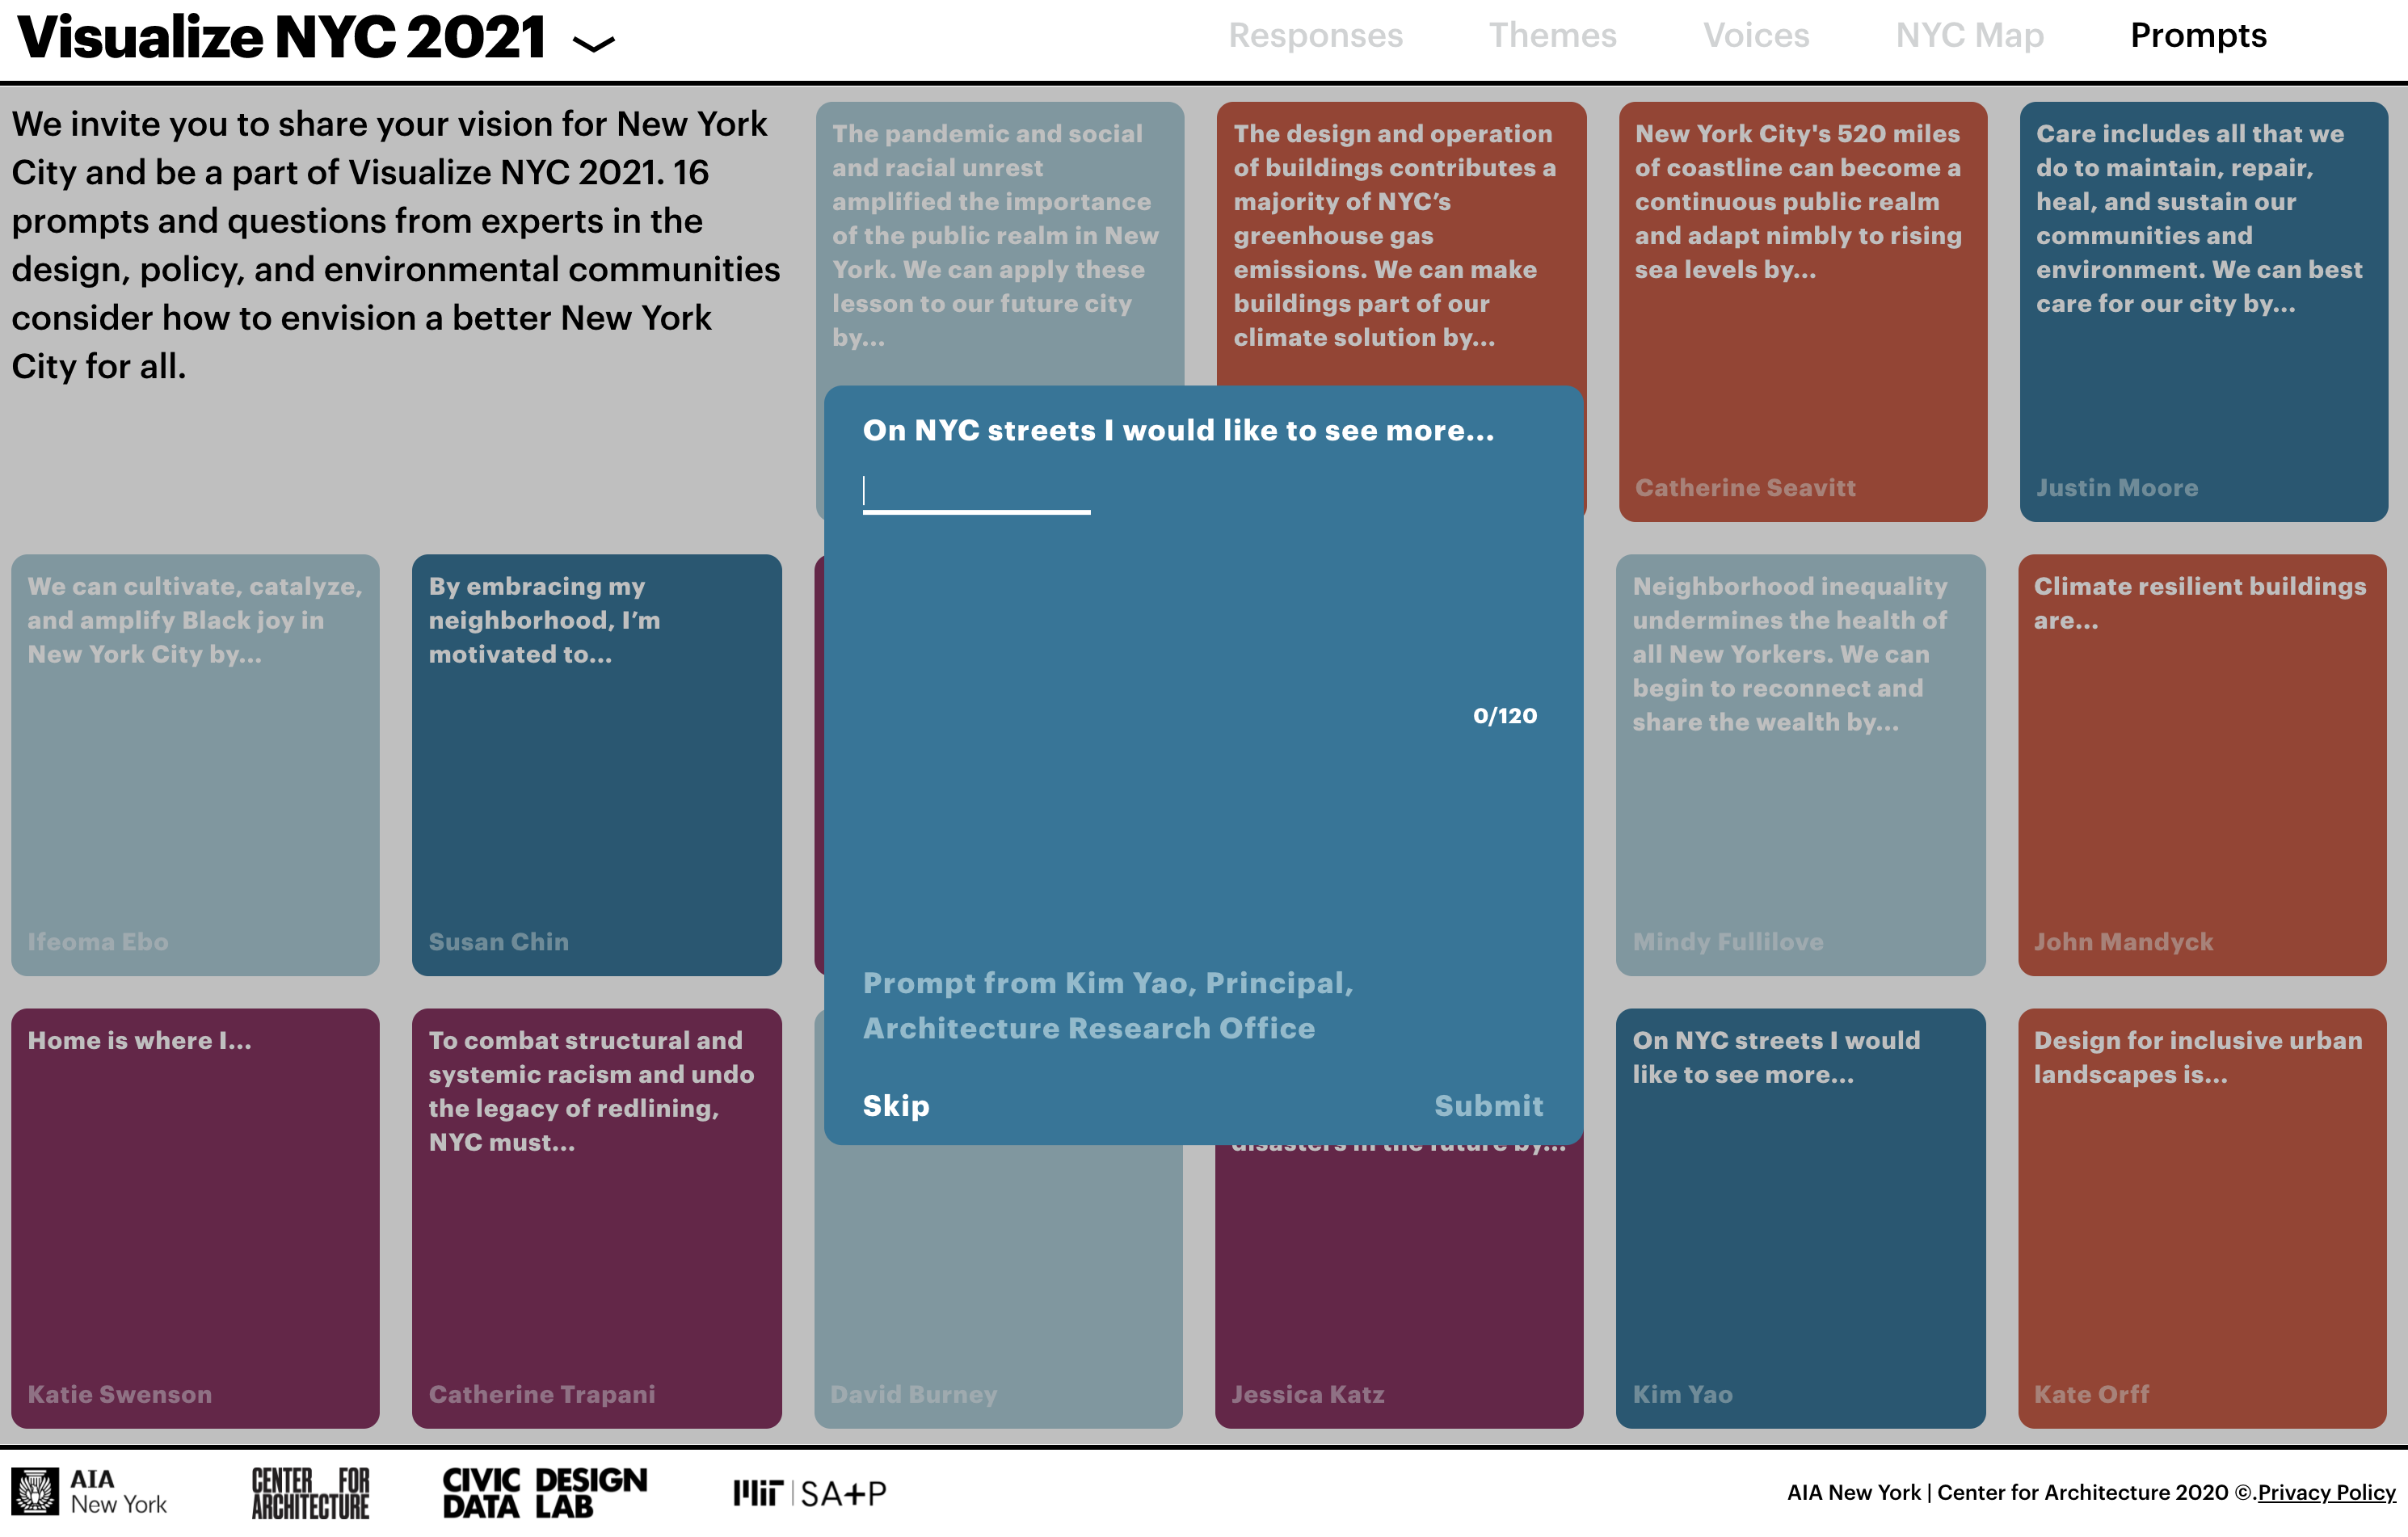
An accompanying crowdsourcing site asks visitors what they want to see for the future of new york city. Anyone who comes to the site is presented with questions related to climate change, public health, the evolving public realm, and the right to housing. The resulting visualizations paint a crowdsourced picture of New Yorkers’ wants, needs, concerns, and dreams.
Taken together, Visualize NYC 2021 and its mini-site offer a playful and insightful look at NYC’s immense opportunities for change in the coming year. “Visualize NYC 2021” opens virtually on November 16, 2020. The mini-site launched on October 7, 2020 and is open for public responses at: https://addyourvoice.visualizenyc.net/.
(from MIT Civic Data Design Lab https://civicdatadesignlab.mit.edu/Visualize-NYC-2021)
![]()
![]()
![]()
![]()
![]()
Visualize NYC 2021
; A data-driven exploration of the issues that will shape the future of New York CityMIT Civic Data Design Lab | 2020
Role: Project Management, Website Design (Add your voice), Data visualization(What’s at stake?)
Tools: D3.js
In collaboration with AIA New York and the Center for Architecture, “Visualize NYC 2021” is a virtual exhibition responding to the historic opportunity for change leading up to New York City’s 2021 elections.
The coronavirus pandemic has laid bare the City’s existing social inequities and limitations, opening up conversations about how we might envision a better New York City for all. In parallel, the local elections in November 2021 will see an unprecedented amount of turnover. In addition to the mayor, 41 elected officials will reach term limits, including four borough presidents and up to 35 City Council members and the comptroller. The number of open positions creates a singular opportunity for change in the five boroughs, and the incoming civic leaders will have the potential to remake the political landscape.
The Civic Data Design Lab was asked to help curate the exhibition and explore how data can illuminate the tensions and opportunities in issues that will be central in the 2021 local elections. Students in the Spring 2020 course, “Big Data, Visualization, and Society” worked on data visualizations across five key topic areas: climate change; housing; public realm and our streets; and neighborhood health -- all with a lense towards equity.
An accompanying crowdsourcing site asks visitors what they want to see for the future of new york city. Anyone who comes to the site is presented with questions related to climate change, public health, the evolving public realm, and the right to housing. The resulting visualizations paint a crowdsourced picture of New Yorkers’ wants, needs, concerns, and dreams.
Taken together, Visualize NYC 2021 and its mini-site offer a playful and insightful look at NYC’s immense opportunities for change in the coming year. “Visualize NYC 2021” opens virtually on November 16, 2020. The mini-site launched on October 7, 2020 and is open for public responses at: https://addyourvoice.visualizenyc.net/.
(from MIT Civic Data Design Lab https://civicdatadesignlab.mit.edu/Visualize-NYC-2021)